5. Path Finding Modules
The Path Finding Modules (PFMs) are algorithms for converting images into geometric shapes, they can be configured in the Path Finding Controls panel. They have been designed to be as flexible as possible and to run with almost any combination of settings. This means that they can create many more styles than those you see here. Some of these extra styles are included as presets!
Every Path Finding Module can also be run with CMYK Separation and Colour Match
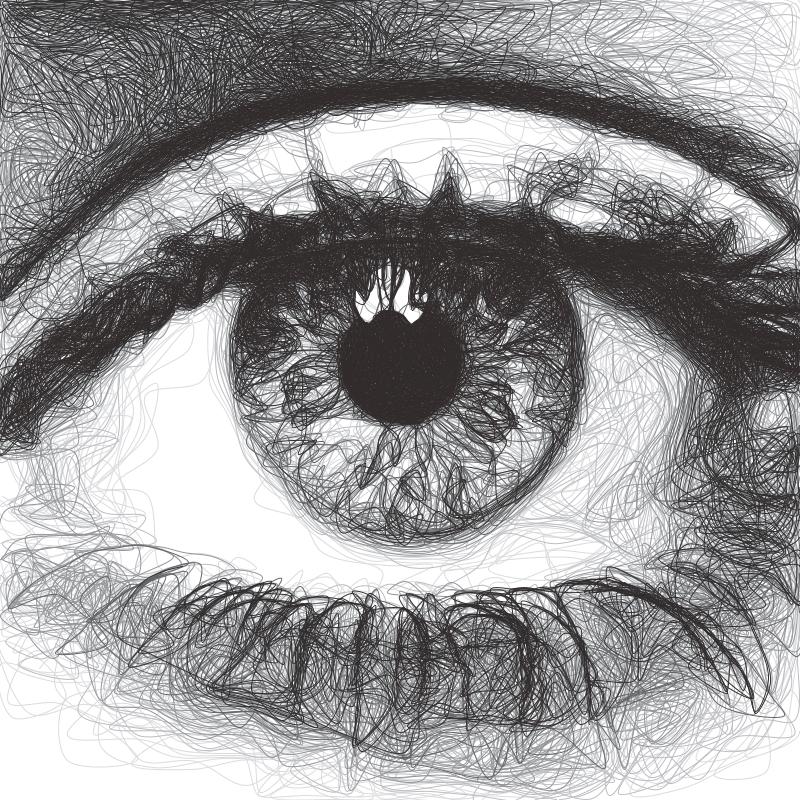
5.1. Sketch PFMs
Sketch PFMs are best used for plots using multiple layers of different pens as the Sketch PFMs rely on the different pens to represent the different tones in the image. However, it is possible to use a single pen with Sketch PFMs though it is recommended to use a pen which is additive where overlapping strokes will result in progressively darker lines.
How do they work?
Find the darkest area of the image
Find the darkest pixel in that area
Finds the next darkest line/curve from that pixel
Brighten the part of the image that the line covers
Repeat steps 2 to 4 until the specified Squiggle Max Length is reached then return to step 1
The process will stop when either the specified Line Density or Line Max Limit has been reached.
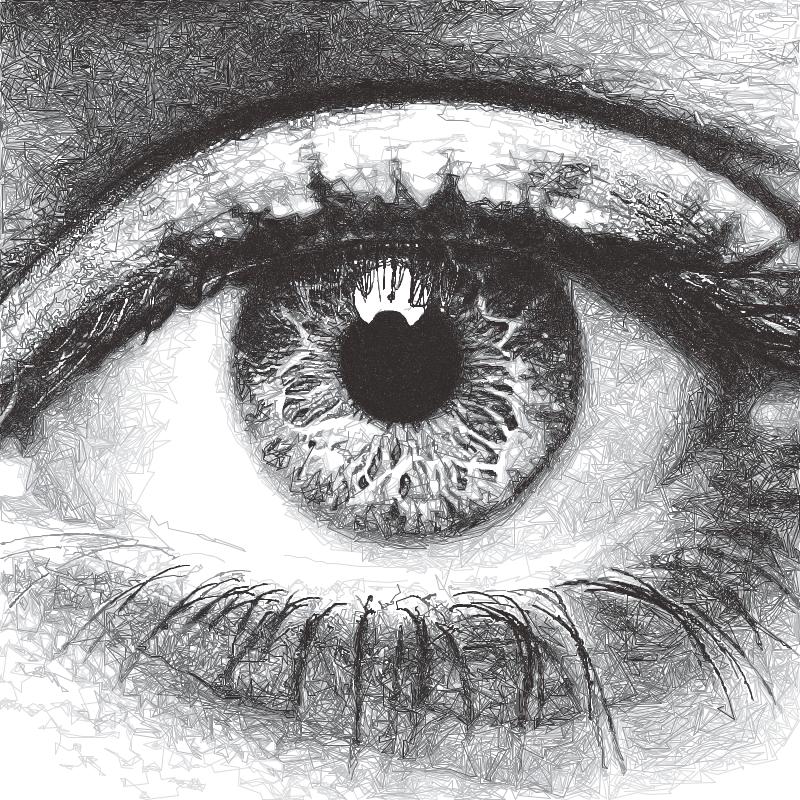
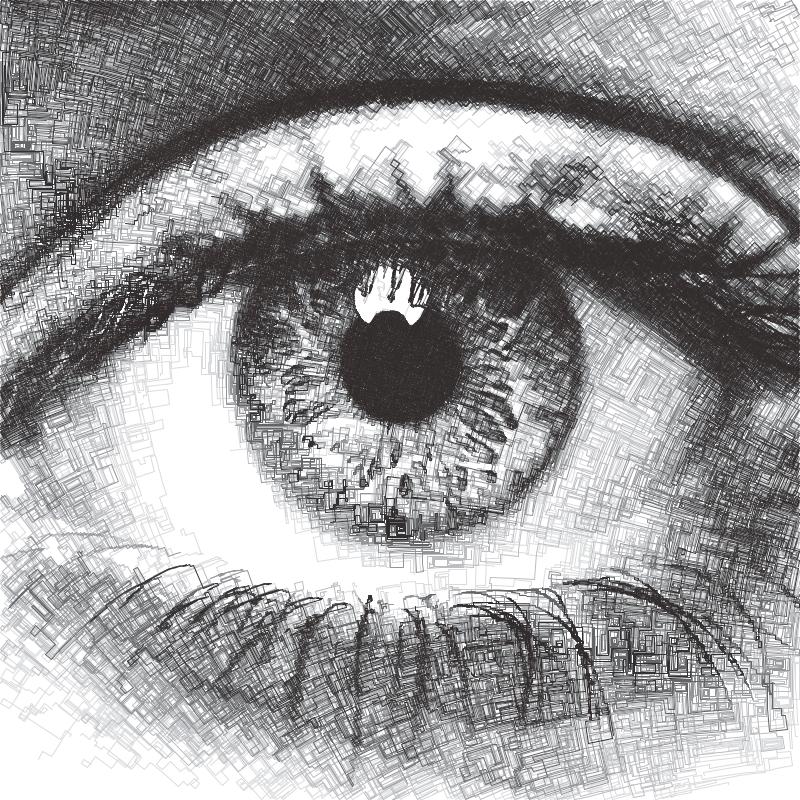
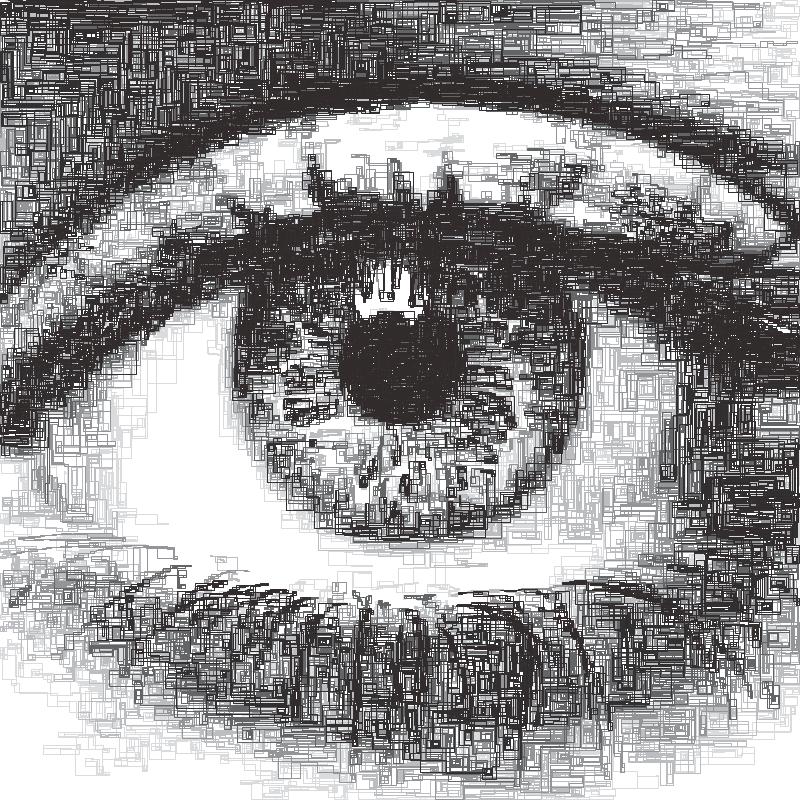
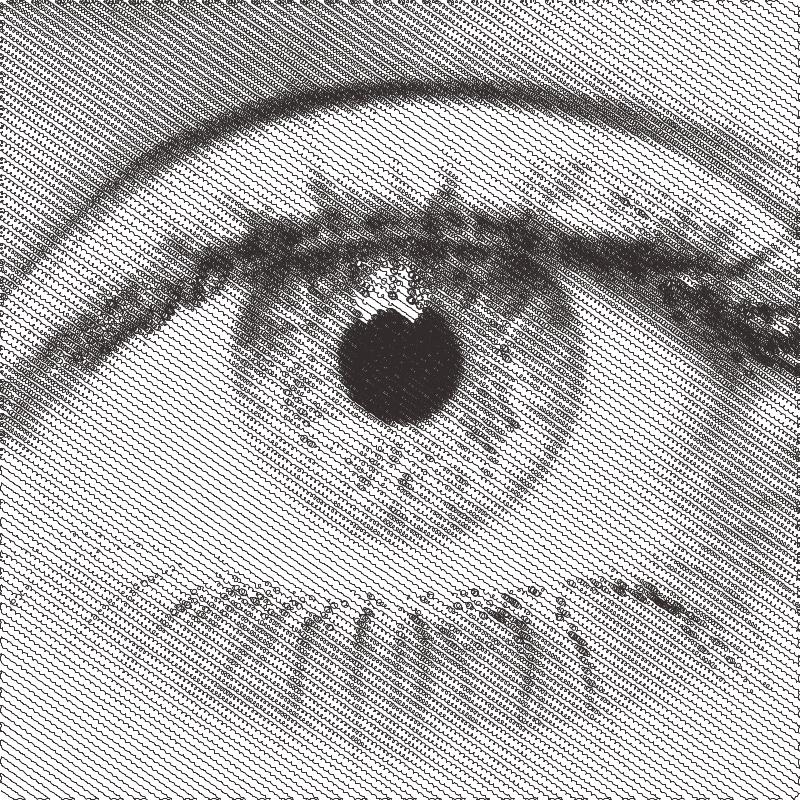
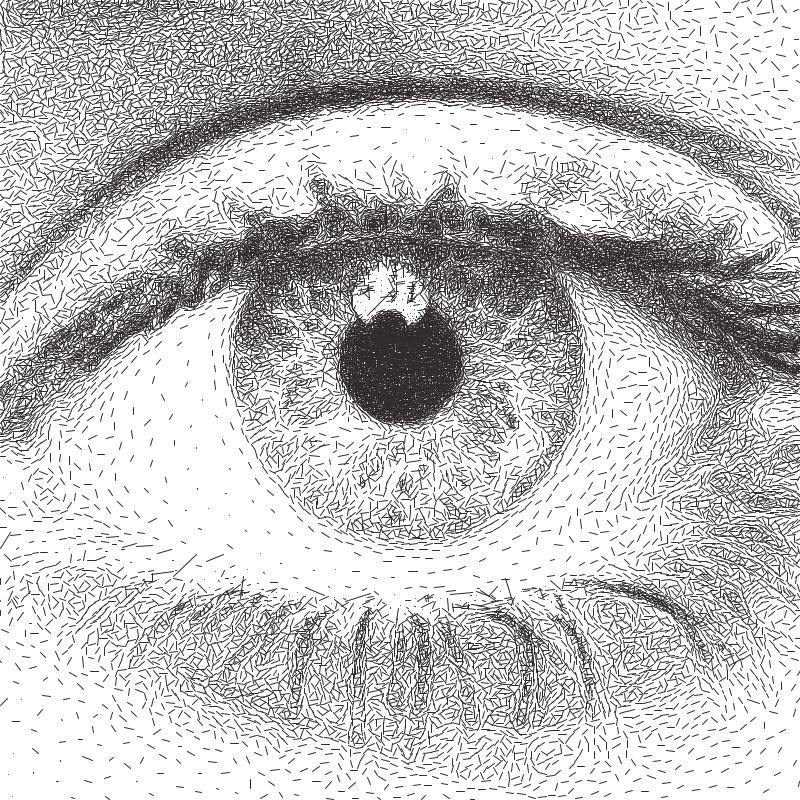
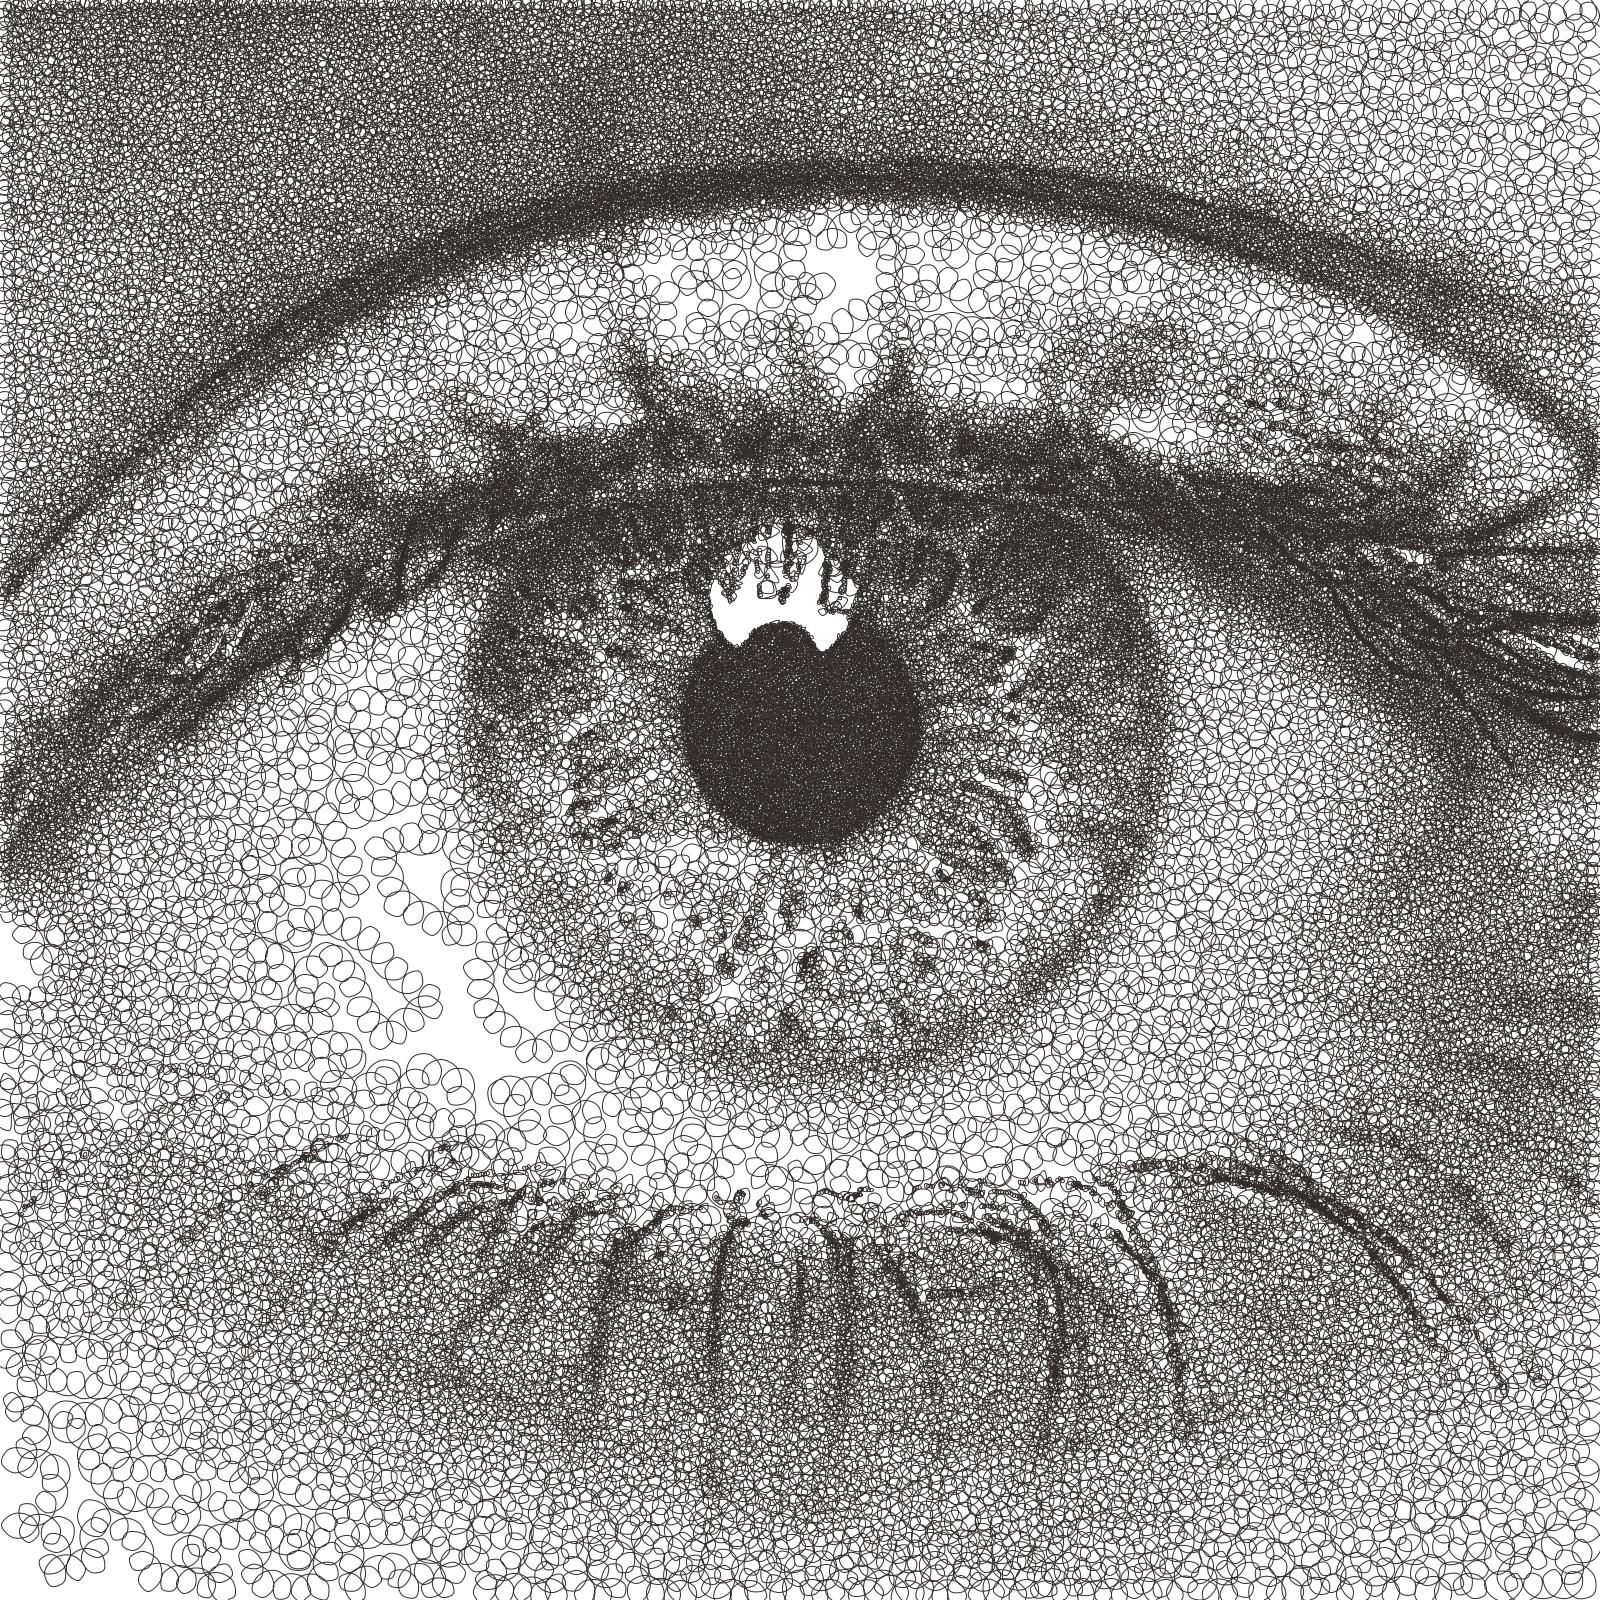
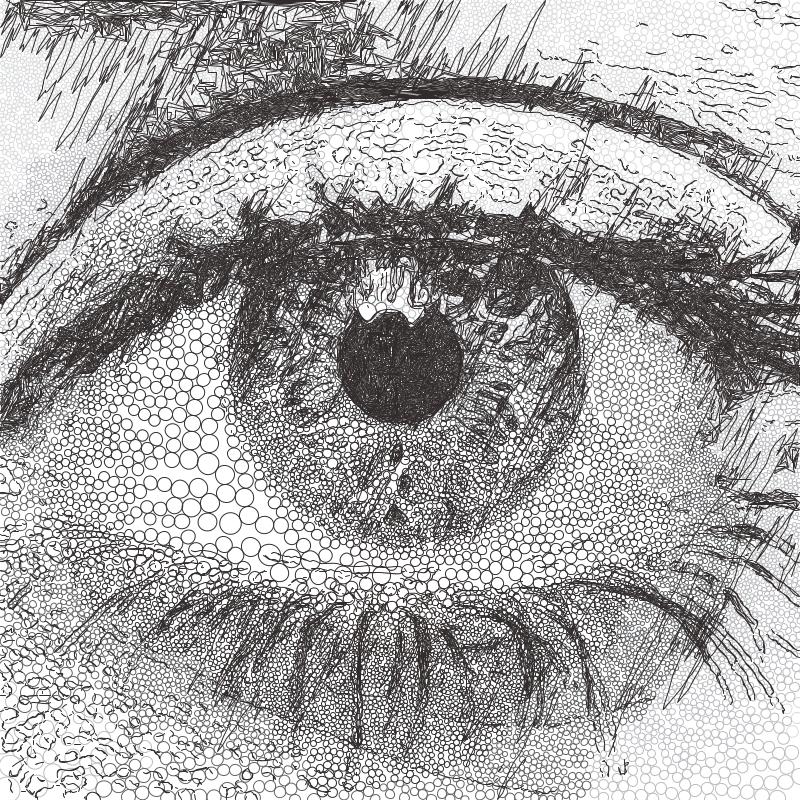
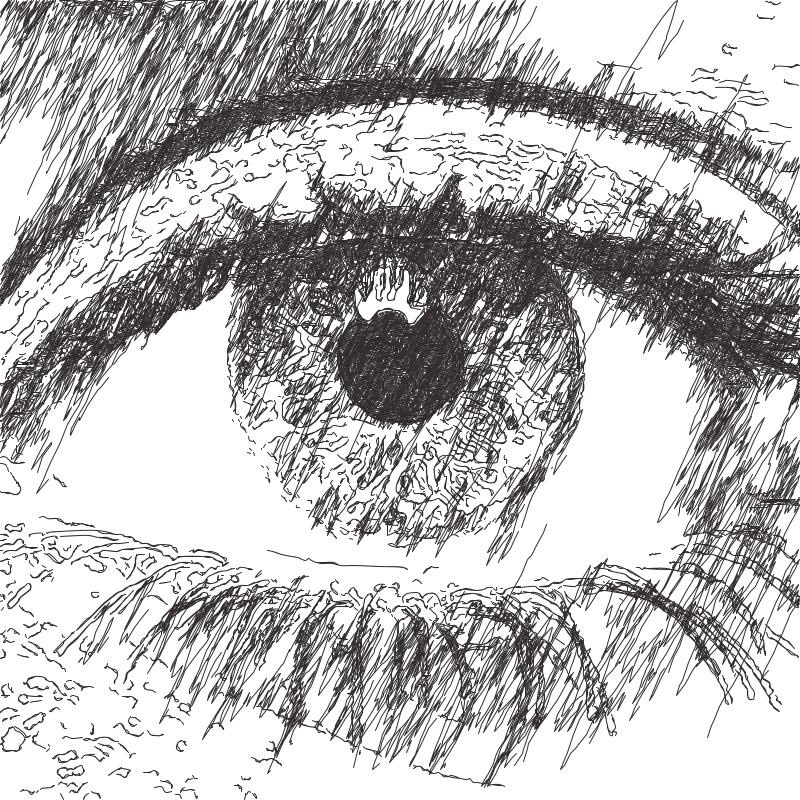
Sketch Lines
Transforms an image into lines using brightness data.
Settings
Default
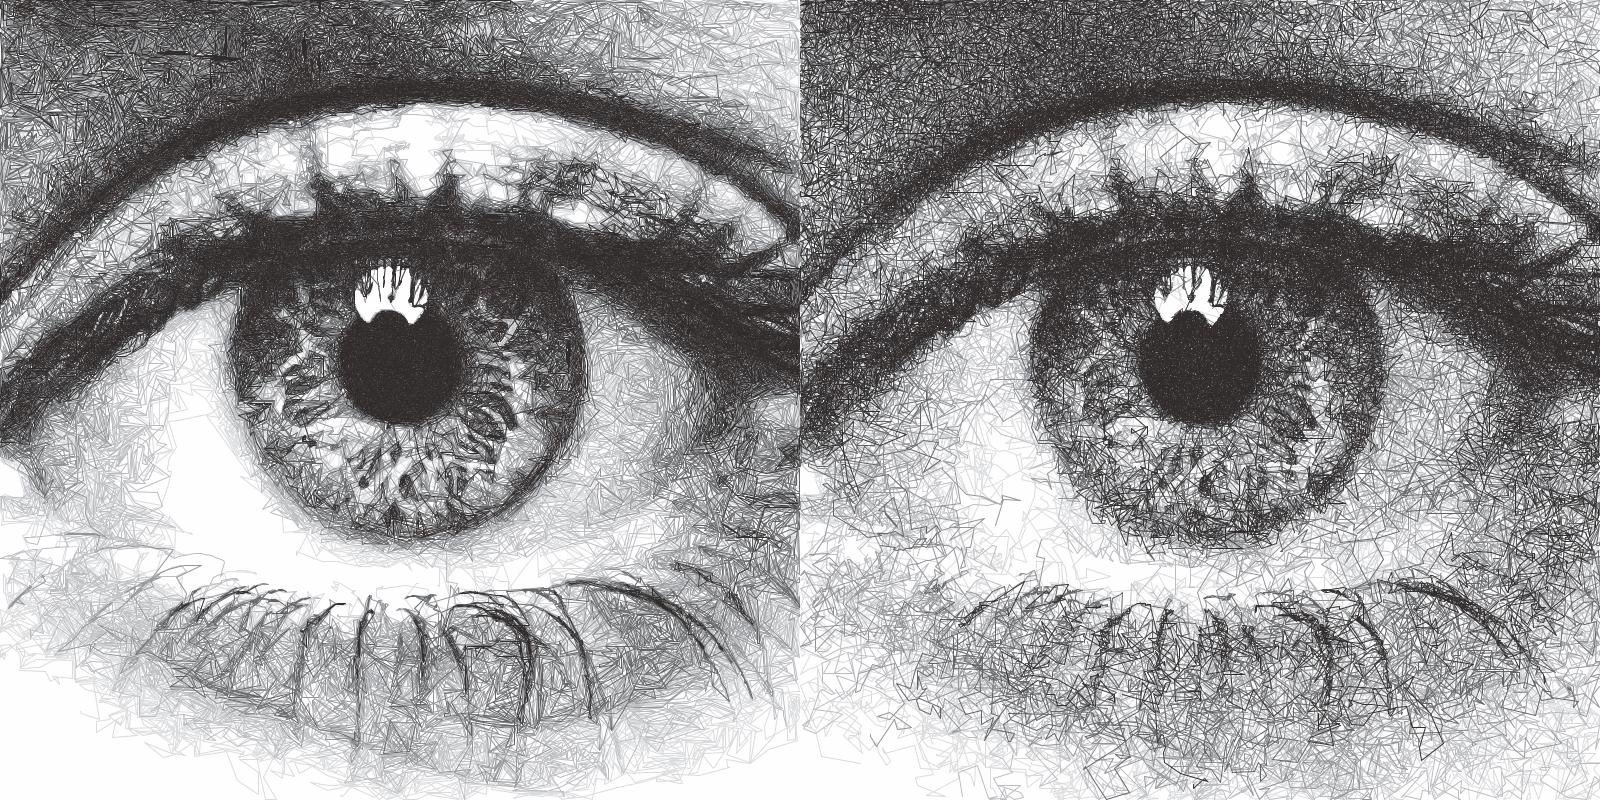
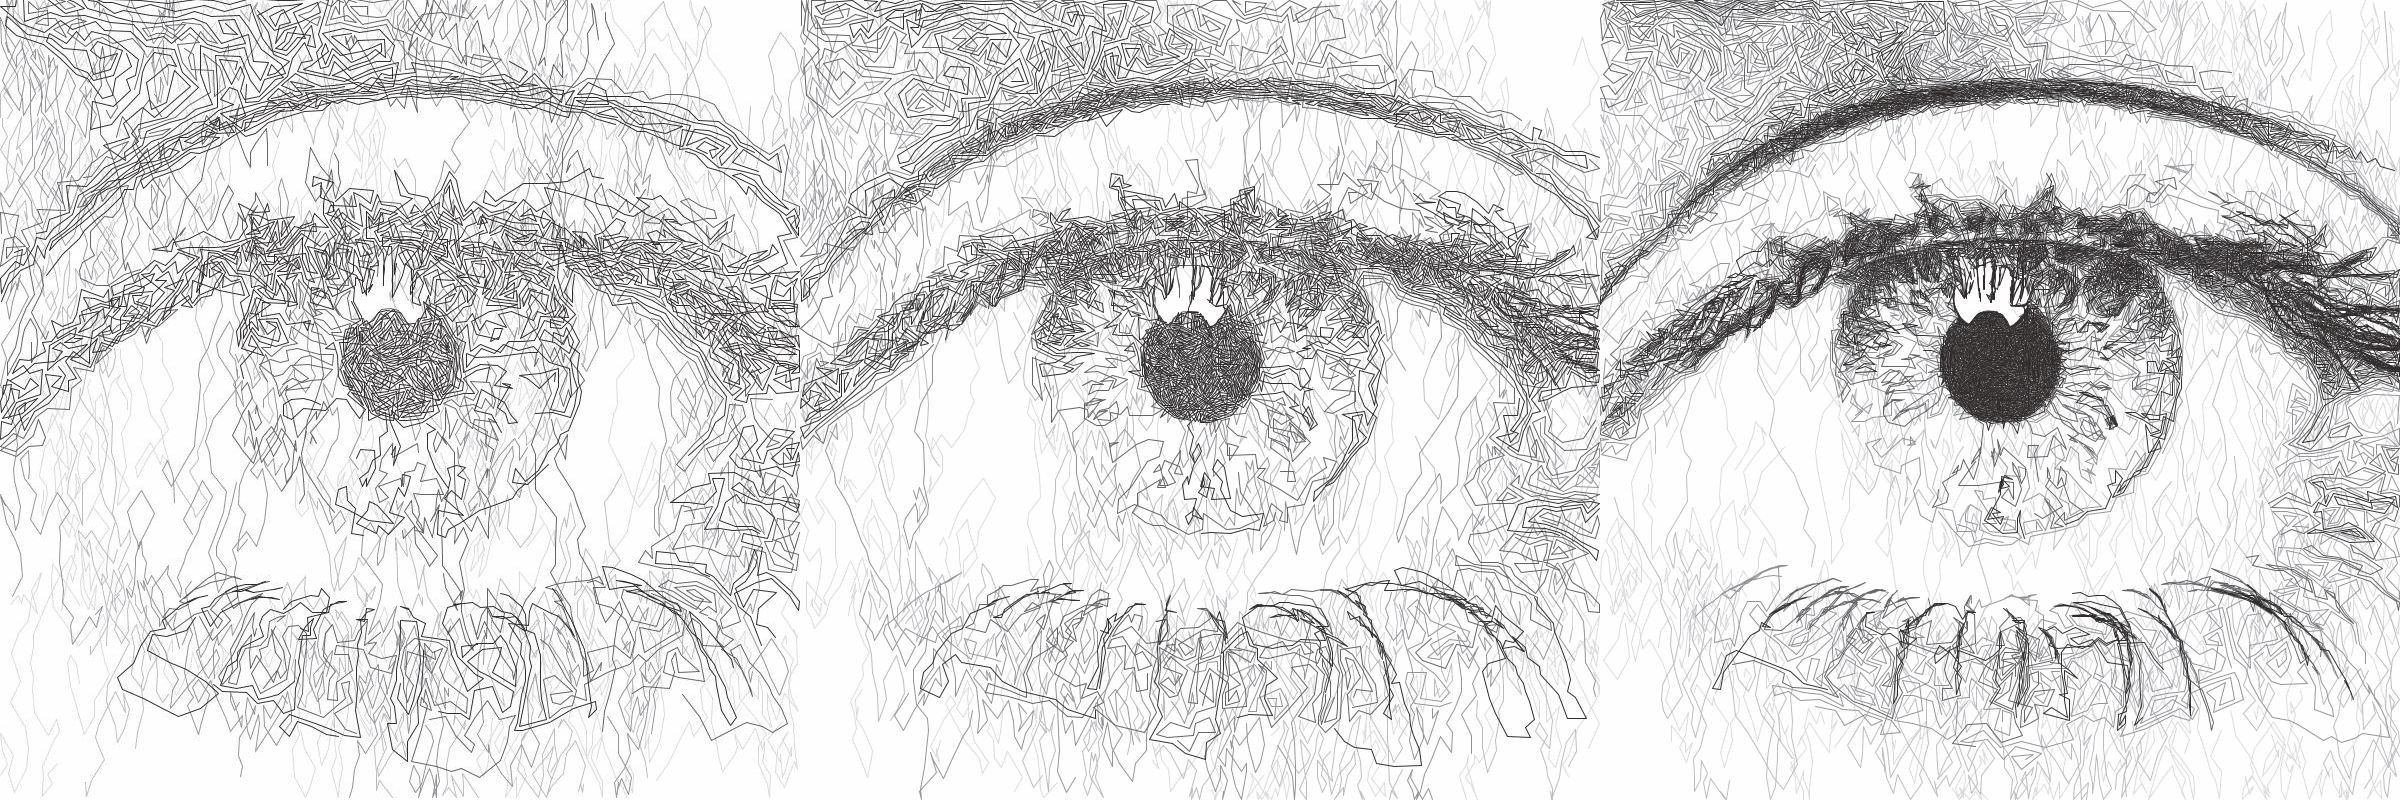
- Plotting Resolution
Values: Number (Safe Range: 0.1 -> 1.0)Controls the resolution of the image used by the PFM but doesn’t change the size of the pen to be used, this is available on almost every PFM!
This is a quick way to increase/decrease the visual quality & density of a drawing and also decrease computation time.
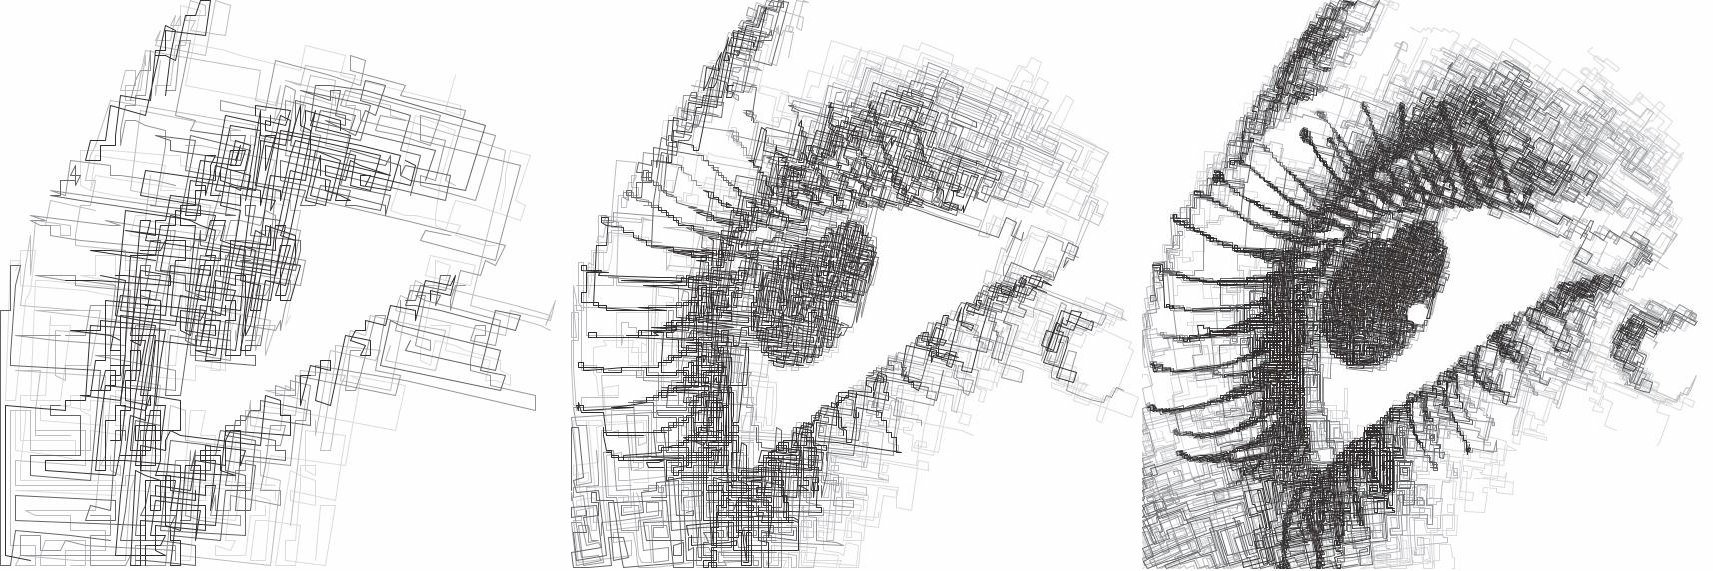
e.g. Fig 1. Plotting Resolution = 0.2, Fig 2. Plotting Resolution = 0.4, Fig 3. Plotting Resolution = 0.7
Quick Tip: You can also enter values higher than the Safe Range, for example using (1.0 -> 1.5) may be enough to get the density you’re aiming for
- Random Seed
Values: NumberUsed to generate all the random numbers used by the PFM. If you use the same Random Seed the PFM will produce the same results when given the same image.
Quick Tip: Created a good style but the lines aren’t falling in quite the right way? Adjust the random seed and to alter the positions of the generated lines.
Style
The style portion of the Sketch PFM settings are great for applying a specific creative style to the generated paths. The majority of the style sliders affect the path processing only and not the original bitmap image.
The values don’t need to add up 100% the balance between all of them decides the weighting of what to emphasise. e.g Directionality of 100% and a Luminance Power of 100%, means that the paths will be 50% driven by the luminance of the image and 50% by the Directionality.
- Should Lift Pen
Values: Boolean (True | False)When True, the pen will be lifted in-between Squiggles.
When False, the PFM will never lift the pen from the paper.
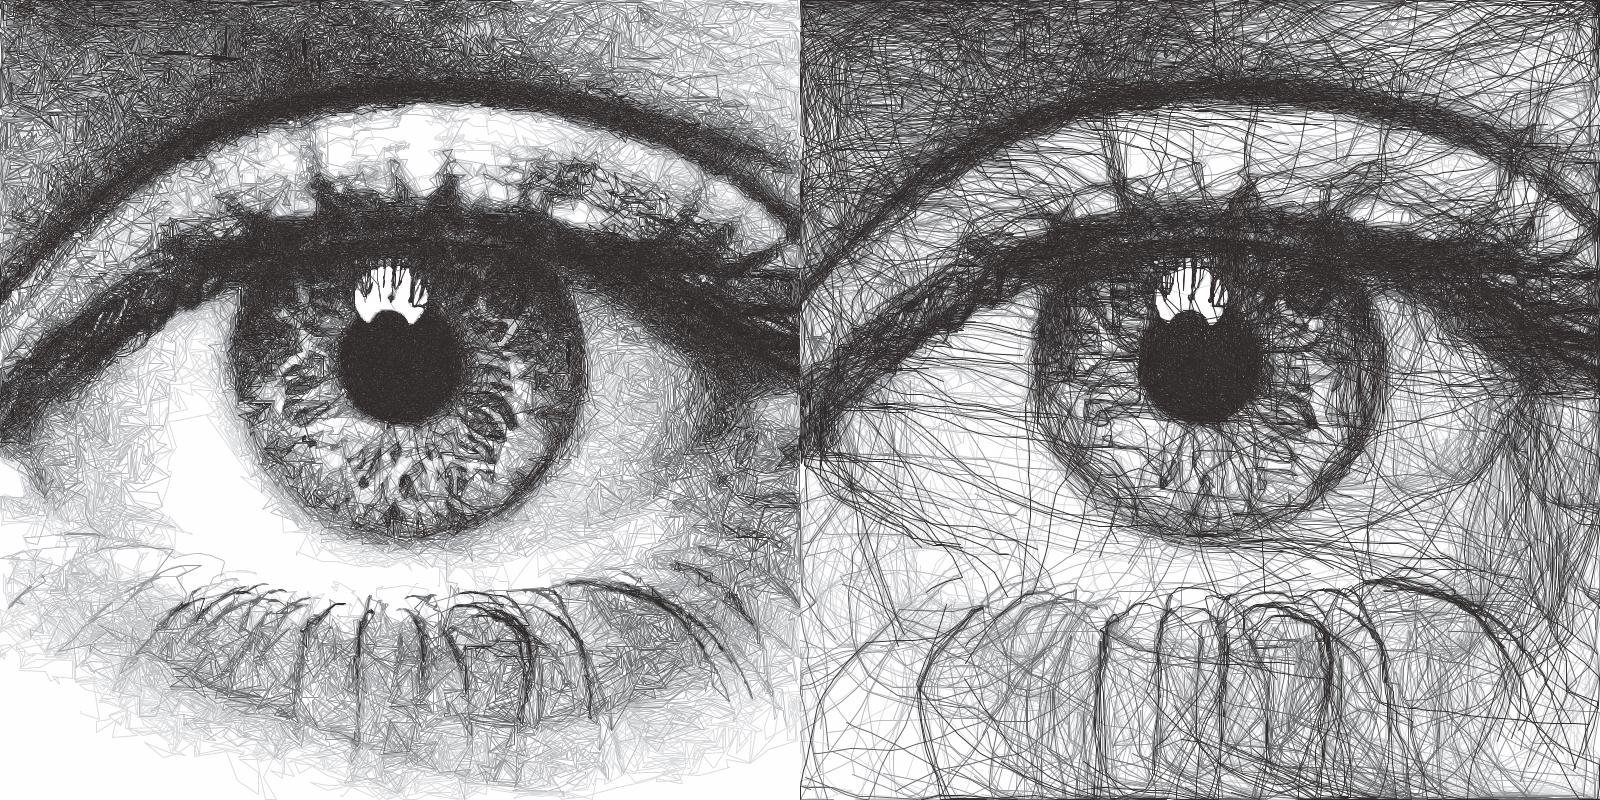
- Directionality
Values: Number (Safe Range: 0 -> 100)Forces the lines to follow the natural contours of the image by pushing the Path Finding process towards the direction of lowest variance.
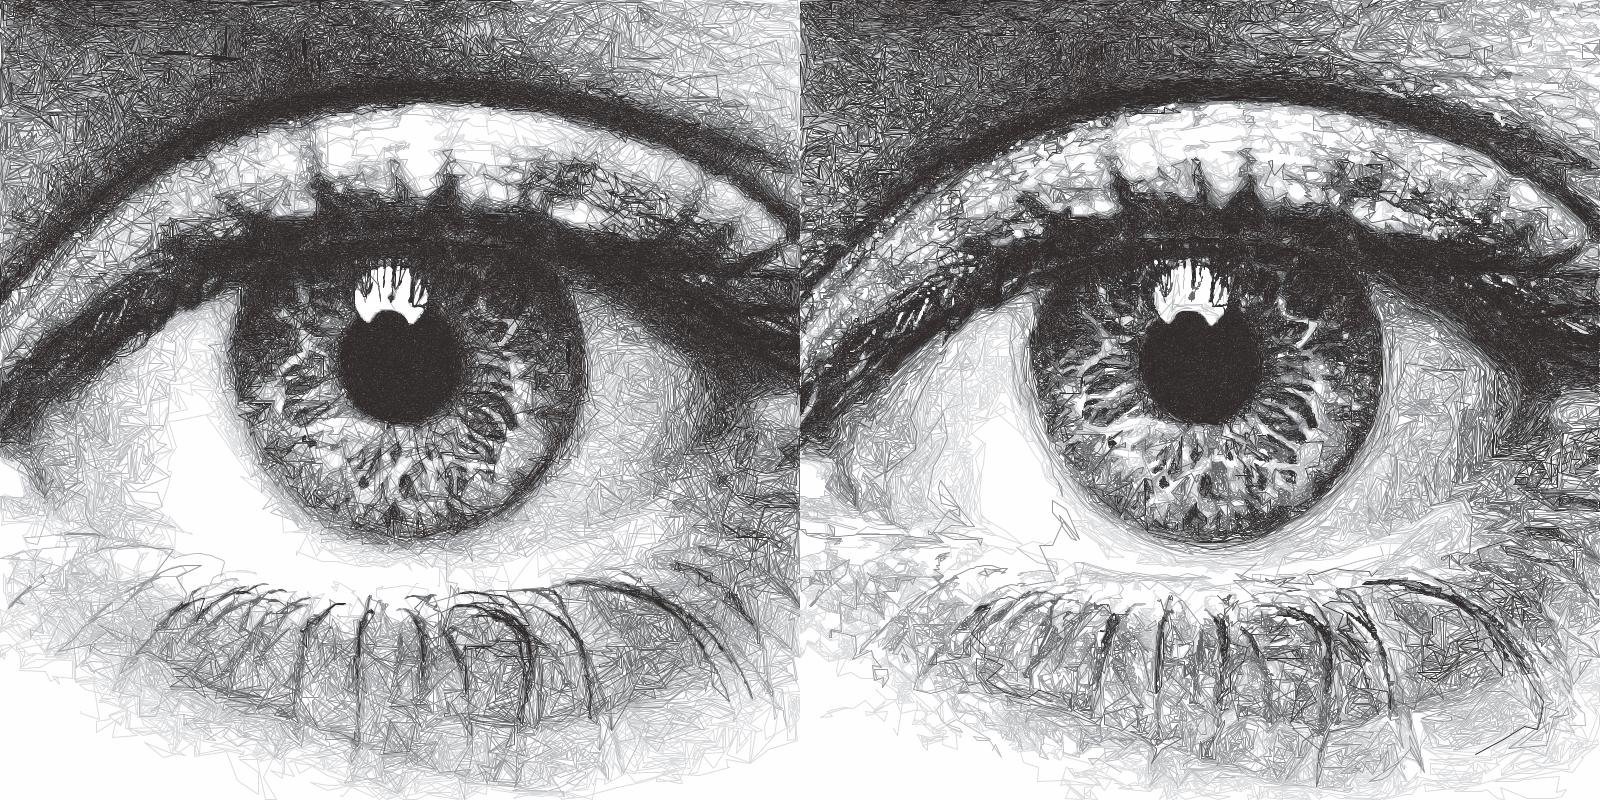
e.g. Fig 1. Directionality = 0, Fig 2. Directionality = 100 - You can see in this example the paths on the right tend to follow the curves of the original image more carefully and don’t fall outside of the shapes as often
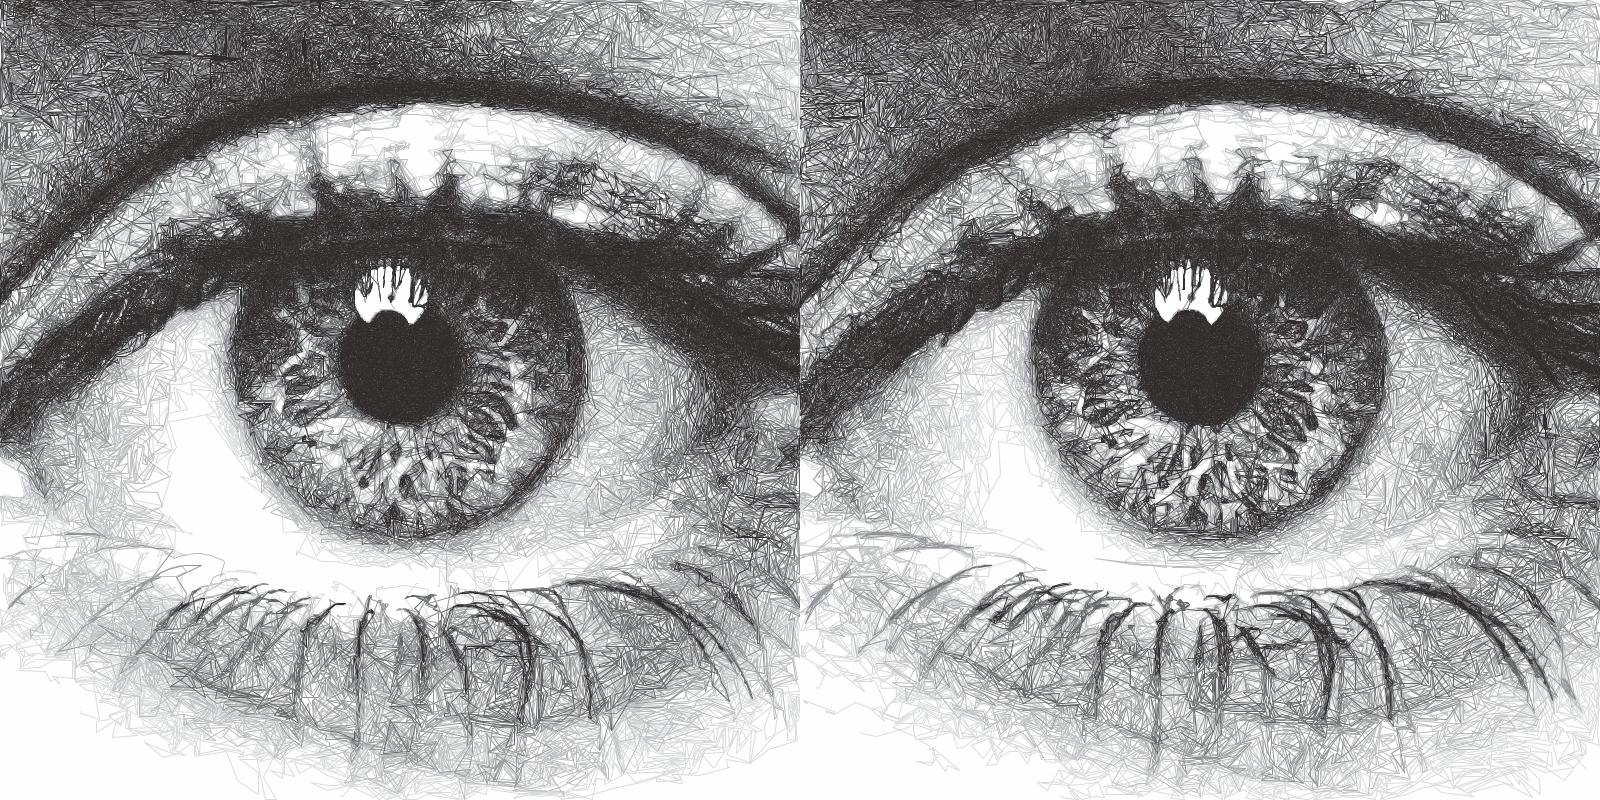
- Clarity
Values: Number (Safe Range: 0 -> 100)Controls a sharpness of the input image, and automatically applies an Unsharp Mask before processing the image.
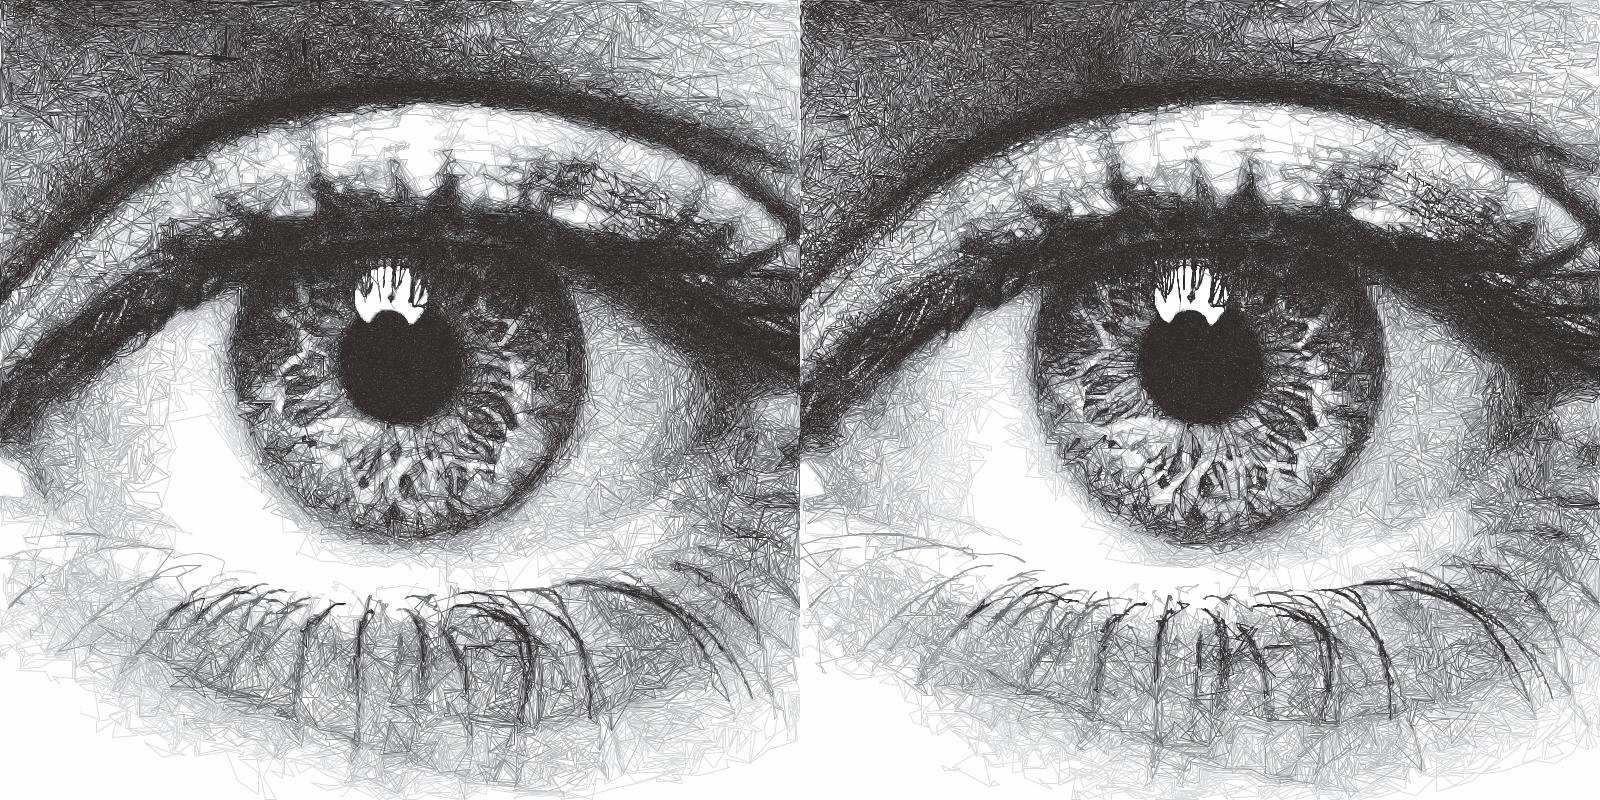
e.g. Fig 1. Clarity = 0, Fig 2. Clarity = 100
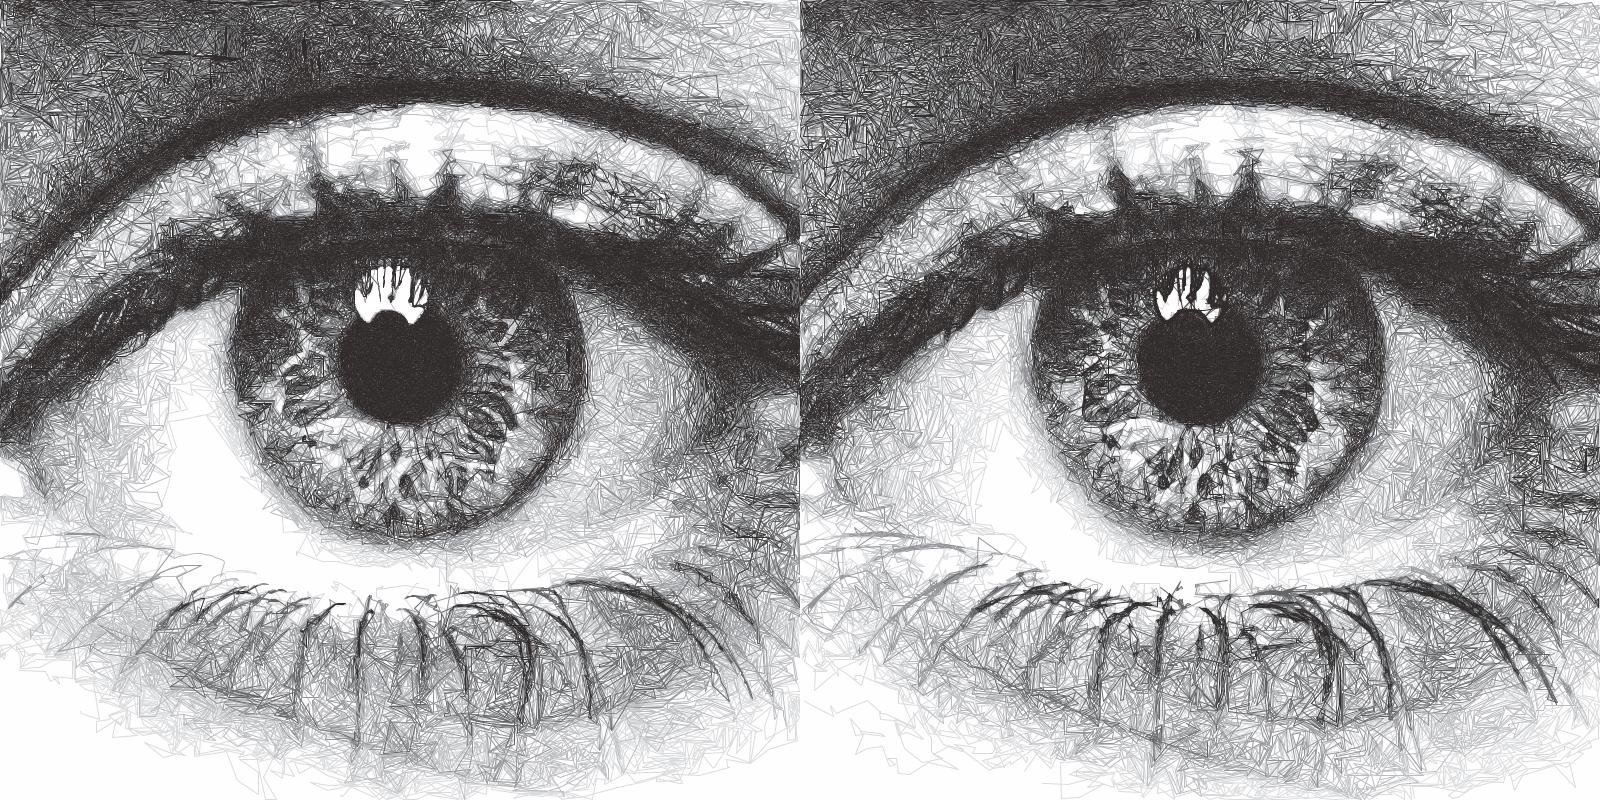
- Distortion
Values: Number (Safe Range: 0 -> 100)Adds some random noise to the generated lines, creating more stylised images.
e.g. Fig 1. Distortion = 0, Fig 2. Distortion = 100
- Angularity
Values: Number (Safe Range: 0 -> 100)Controls the frequency at which lines are allowed to change direction, a higher angularity results in lines which don’t change direction as frequently and cut across the image in more stylised ways.
e.g. Fig 1. Angularity = 0, Fig 2. Angularity = 50
- Edge Power
Values: Number (Safe Range: 0 -> 100)Pushes the Path Finding process to edges detected by Canny Edge Detection, which is very accurate and will highlight sharp edges, keeping more detail in the image.
e.g. Fig 1. Edge Power = 0, Fig 2. Edge Power = 100
- Sobel Power
Values: Number (Safe Range: 0 -> 100)Similar to Edge Power but uses a Sobel Edge Filter instead of Canny Edge Detection, which results in less accurate edges and creates an exaggerated cartoonish quality on the plot.
e.g. Fig 1. Sobel Power = 0, Fig 2. Sobel Power = 100
- Luminance Power
Values: Number (Safe Range: 0 -> 100)Luminance Power is what typically drives the Path Finding Process so should usually be left at 100%, and the other style sliders should be introduced bit by bit. Typically PFMs will follow dark areas in the image when creating lines, this slider can be used to decrease the influence of brightness which in turn will favour other style options like Directionarity or Edge Power etc.
- Drawing Delta Angle
Values: Number (Range: -360 -> 360)Controls the directions that the PFM can travel during the Path Finding Process.
Segments
- Line Density
Values: Percentage (Range: 0 -> 100)Affects the total number of segments in the final drawing and therefore the computation time. This setting drives the progress bar and when it reaches 100% processing stops.
\(progress = (avgLuminance - initialLuminance) / (desiredLuminance - initialLuminance)*lineDensity\)
Quick Tip: Reducing the Displayed Shapes slider above the viewport has the same effect as decreasing the Line Density. So if the density is too high you can reduce it later.
- Line Min Length
Values: Number (Safe Range: 2 -> 500)The minimum length of each segment, see Line Max Length for more details.
- Line Max Length
Values: Number (Safe Range: 2 -> 500)The maximum length of each segment, Line Min Length defines the minimum.
Decreasing the Min/Max Length will increase the detail retention in the final plot as each segment will be more accurate.
Increasing the Min/Max Length will increase the length of generated lines and decrease the accuracy of the final plot.
- Line Max Limit
Values: Number (Safe Range: -1 -> 1000000)Limits the total number of segments. Will only have an effect if this limit is reached before the chosen Line Density.
When the Max Limit is -1, the limit will be ignored.
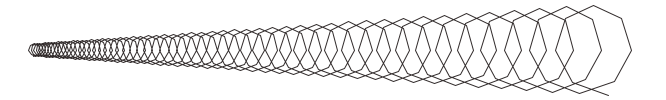
- Angle Tests
Values: Number (Safe Range: 1 -> 360)Controls the accuracy of the generated lines. When finding the next segment the PFM will generate new segments travelling in different directions and then compare them. The Angle Tests controls the number of new segments to generate at each position.
Quick Tip: This control can also be used creatively, try setting it to 3, 4 or 6. You’ll see the PFM generate Triangles, Squares and Hexagonal Lines.
- Unlimited Tests
Values: Boolean (True | False)Will run as many angle tests as required to find the “best” line possible, resulting in more accurate drawings with longer processing times.
Squiggles
A path of segments(lines/curves) is called a squiggle. Each squiggle is continuous and doesn’t include any pen lifts.
You can use this area of the PFM to reduce the plotting time of sketches generated but at the trade-off of losing smaller details and potentially having squiggles crossing bright areas of the source image.
Shorter Squiggles = Longer Plotting Time & Higher Quality Output Longer Squiggles = Shorter Plotting & Lower Quality Output
- Squiggle Min Length
Values: Number (Safe Range: 0 -> 5000)Defines the minimum number of segments for each squiggle, setting a minimum length prevents incredibly short squiggles from being created, shortening plotting times.
e.g. Squiggle Min Length = 100, every squiggle would consist of at least 100+ segments.
- Squiggle Max Length
Values: Number (Safe Range: 0 -> 5000)Defines the cut-off for the maximum number of segments allowed in each squiggle. Once the squiggle has reached the max length the pen will be lifted and move to a new location.
Increasing the Max Length will decrease the plotting time, but may create a poor distribution of tones.
- Squiggle Max Deviation
Values: Percentage (Safe Range: 0 -> 100)Control how far a squiggle is allowed to deviate in brightness before it is ended prematurely. This has the result of making shorter squiggles which are more accurate and less likely to cross over brighter areas of the image. Increasing the allowed deviation will result in a less accurate drawing with fewer pen lifts.
If you notice your drawing has lines crossing bright areas of the image that you wish to remove, you can try lowering the Max Deviation and lowering the Squiggle Min Length.
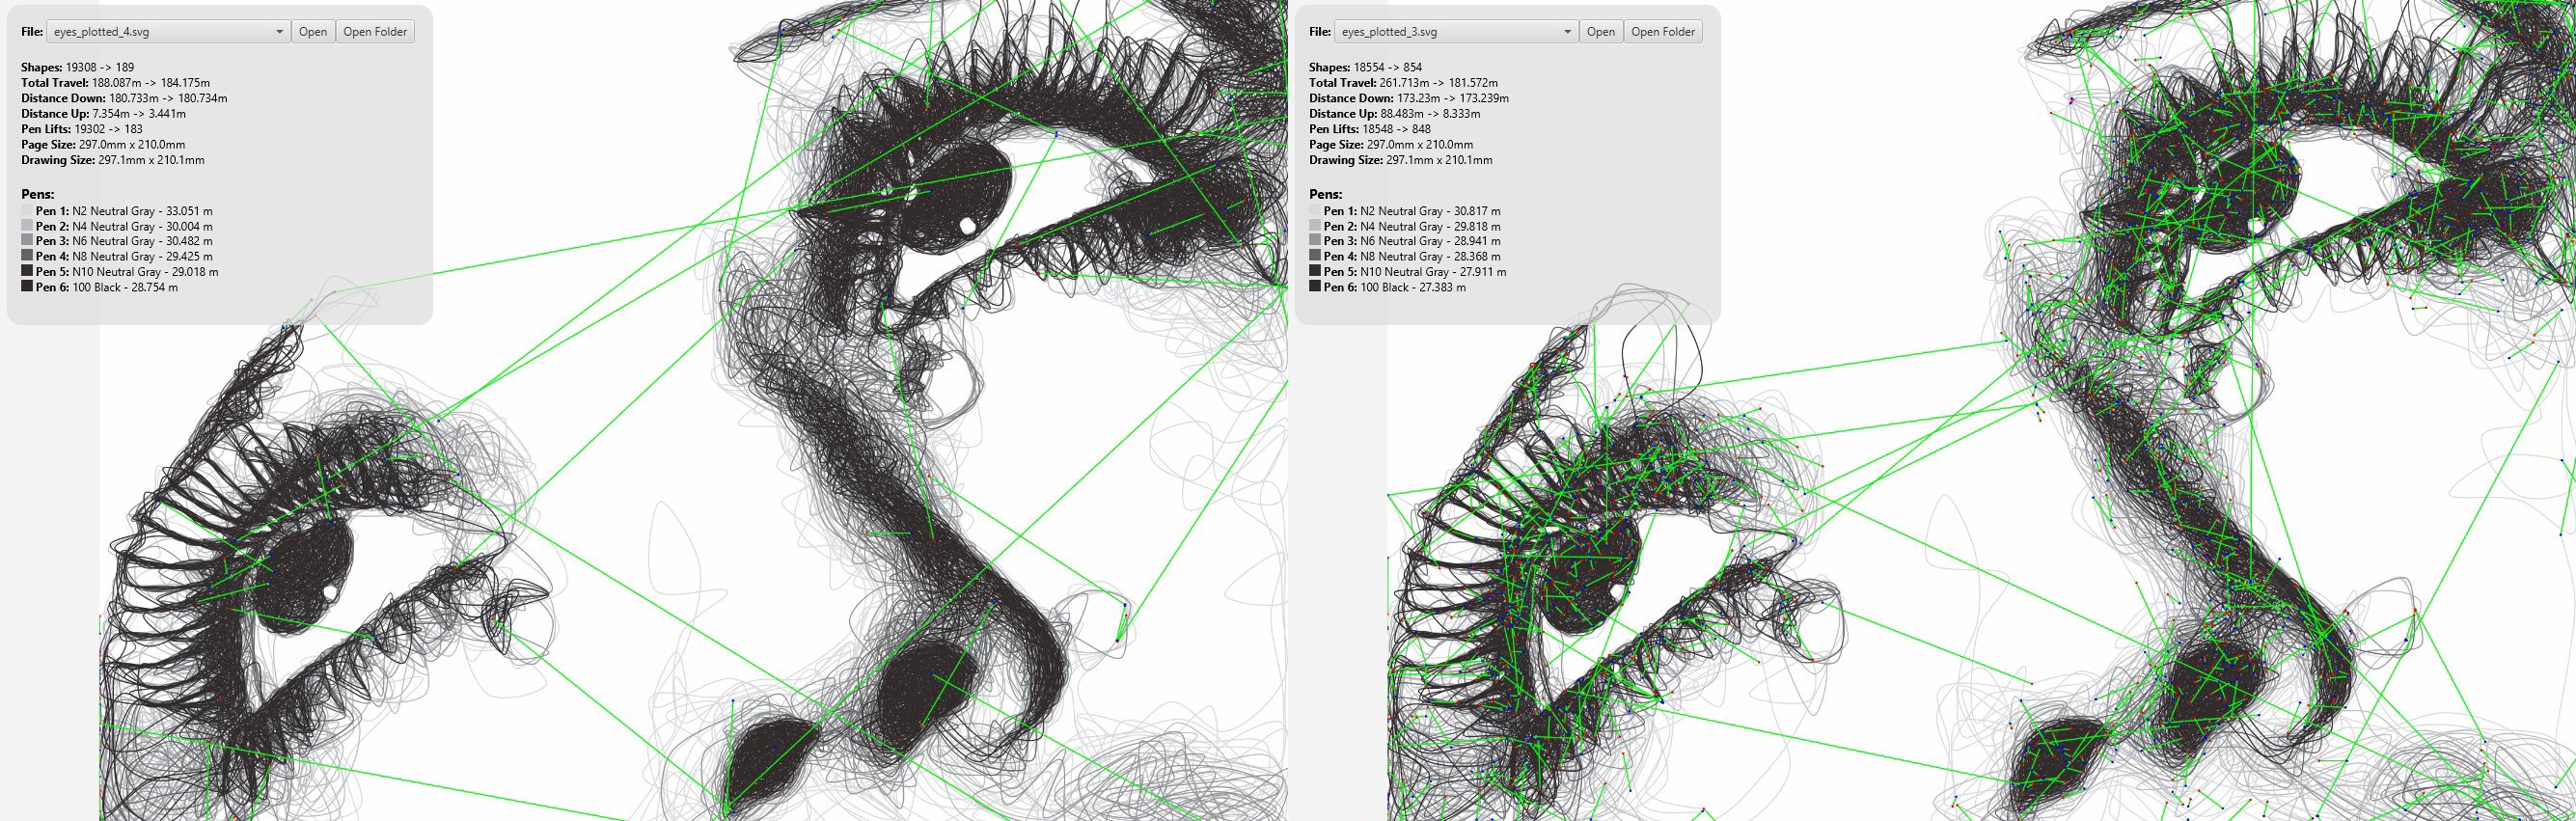
e.g. Fig 1. Squiggle Max Deviation = 5, Fig 2. Squiggle Max Deviation = 1000 - The green lines show the plotter’s travel while the pen is up. The overall distance of the plot changed by a few metres, and the number of pen lifts was dramatically reduced. The default Squiggle Max Deviation of 25 provides a good middle-ground, keeping quality while not having too many pen lifts.
Erasing
Sketch PFMs use a Lightened Image to keep track of the areas which have been drawn over. When a line is drawn it is erased from the Working Image, so when the same area is next considered, lines will be less likely to cross over.
You can view the Lightened Image in your viewport by going to “Display / Lightened” after the drawing has finished processing.
e.g. Fig 1. Original Image, Fig 2. Lightened/Erased Image, Fig 3. Sketch Lines Result
- Erase Min
Values: Number (Range: 0 -> 255)Controls the minimum intensity of the __`Erasing` process, see Erase Max for more details.
- Erase Max
Values: Number (Range: 0 -> 255)Controls the maximum intensity of the __`Erasing` process, with Erase Min defining the minimum.
Erase Min/Max alters the amount to brighten each RGB channel in the Lightened Image.
It therefore controls the overall plot density & contrast in the image and can be fine-tuned to your specific pens.
The Tone setting alters the interpolation between these two values.
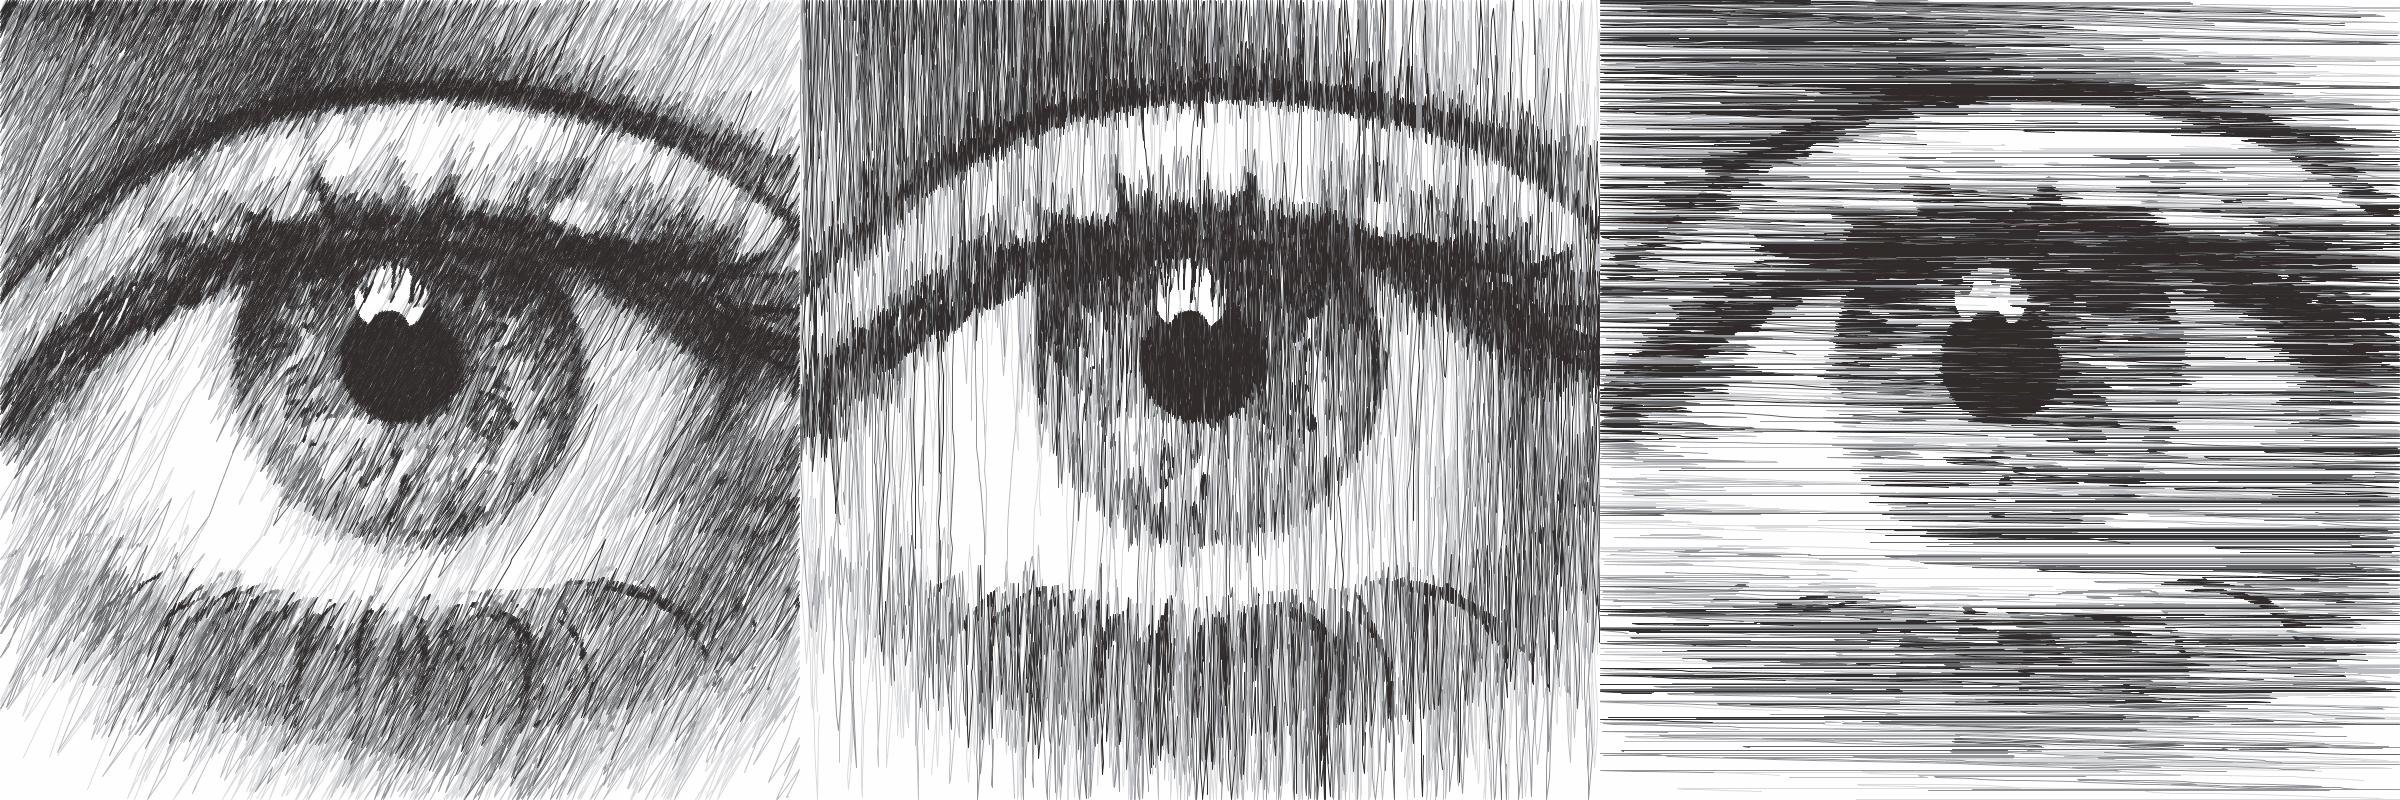
e.g. Fig 1. Erase Min = 50 & Erase Max = 50, Fig 2. Erase Min = 50 & Erase Max = 125 (Default), Fig 3. Erase Min = 50 & Erase Max = 255
Quick Tip: Are your Physical Plots coming out too dense and soaking the paper?
Try increasing the Erase Min/Max to reduce the amount of overlap.
- Erase Radius Min
Values: Number (Range: 0 -> 50)Controls the minimum radius of the shapes drawn by the __`Erasing` process, see Erase Radius Max for more details.
- Erase Radius Max
Values: Number (Range: 0 -> 50)Controls the maximum radius of the __`Erasing` process, with Erase Radius Min defining the minimum.
It therefore controls the spread of shapes in the image and the overall plot density.
The Tone setting alters the interpolation between these two values.
Quick Tip: Are you wanting to plot with a single pen? Increasing the Erase Radius Max is a great way to introduce contrast back into the drawing.
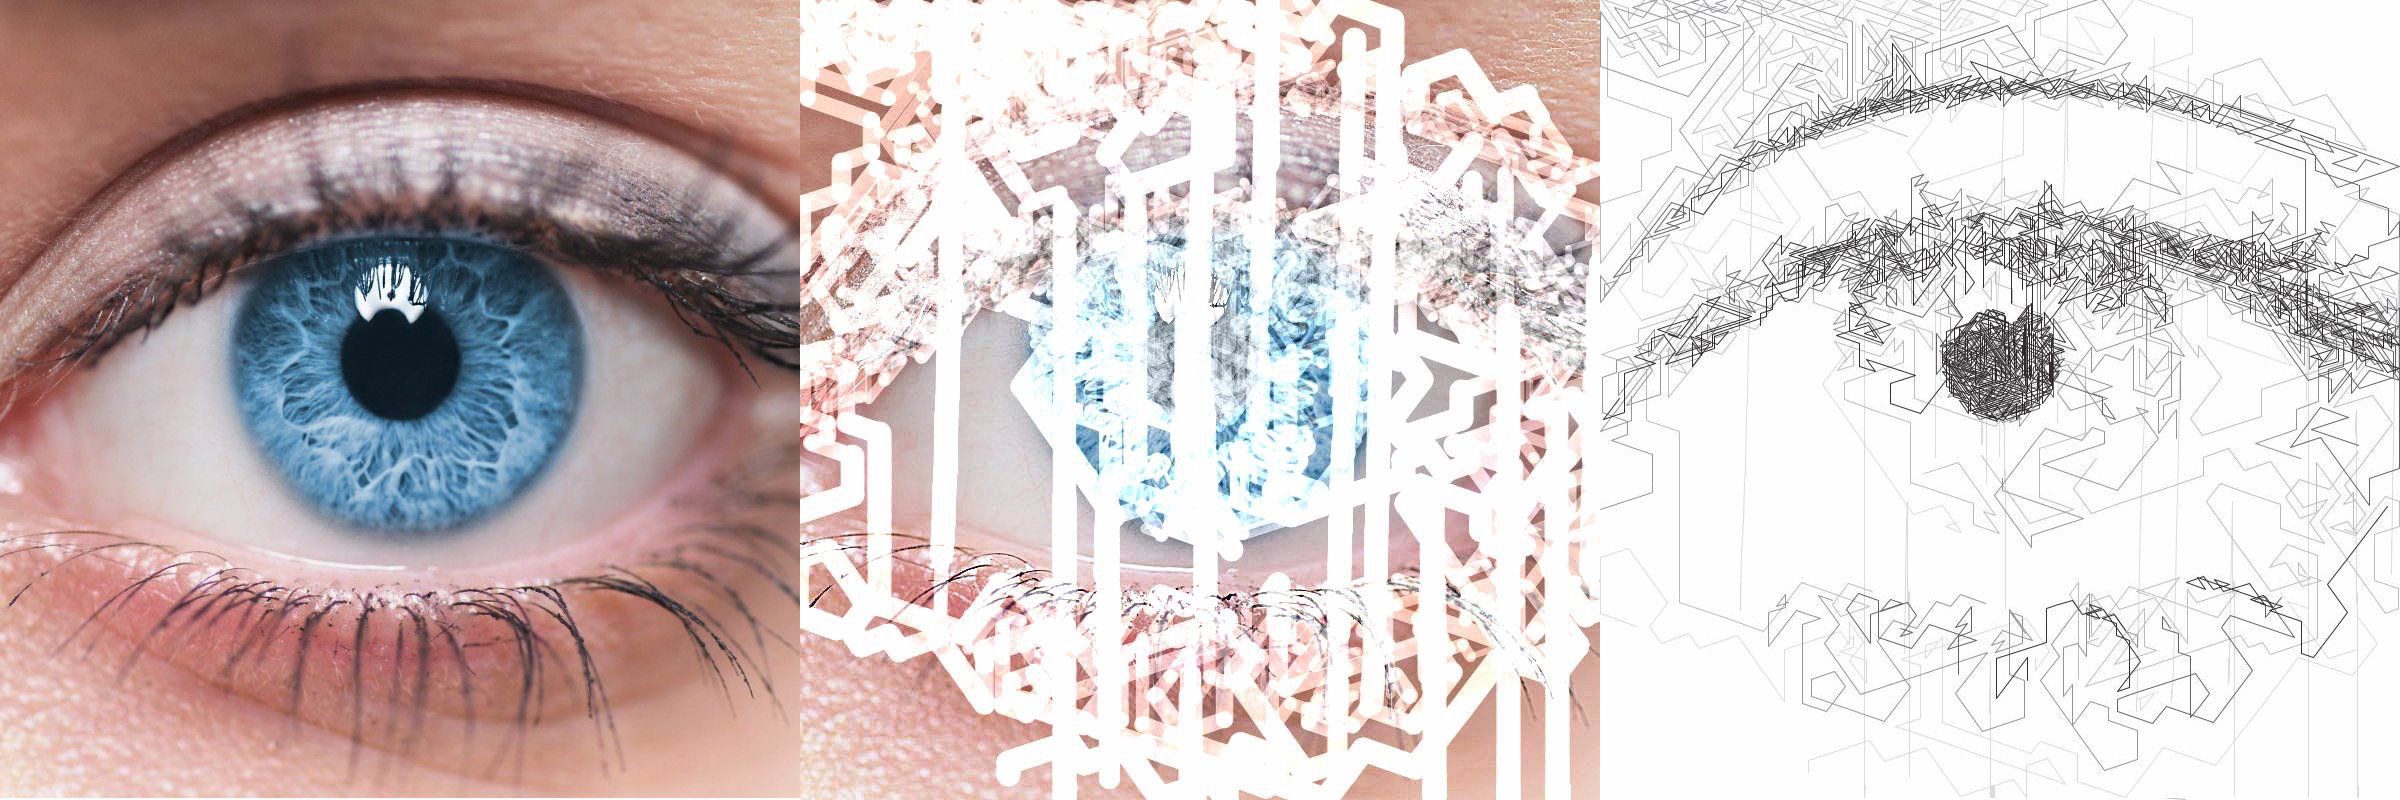
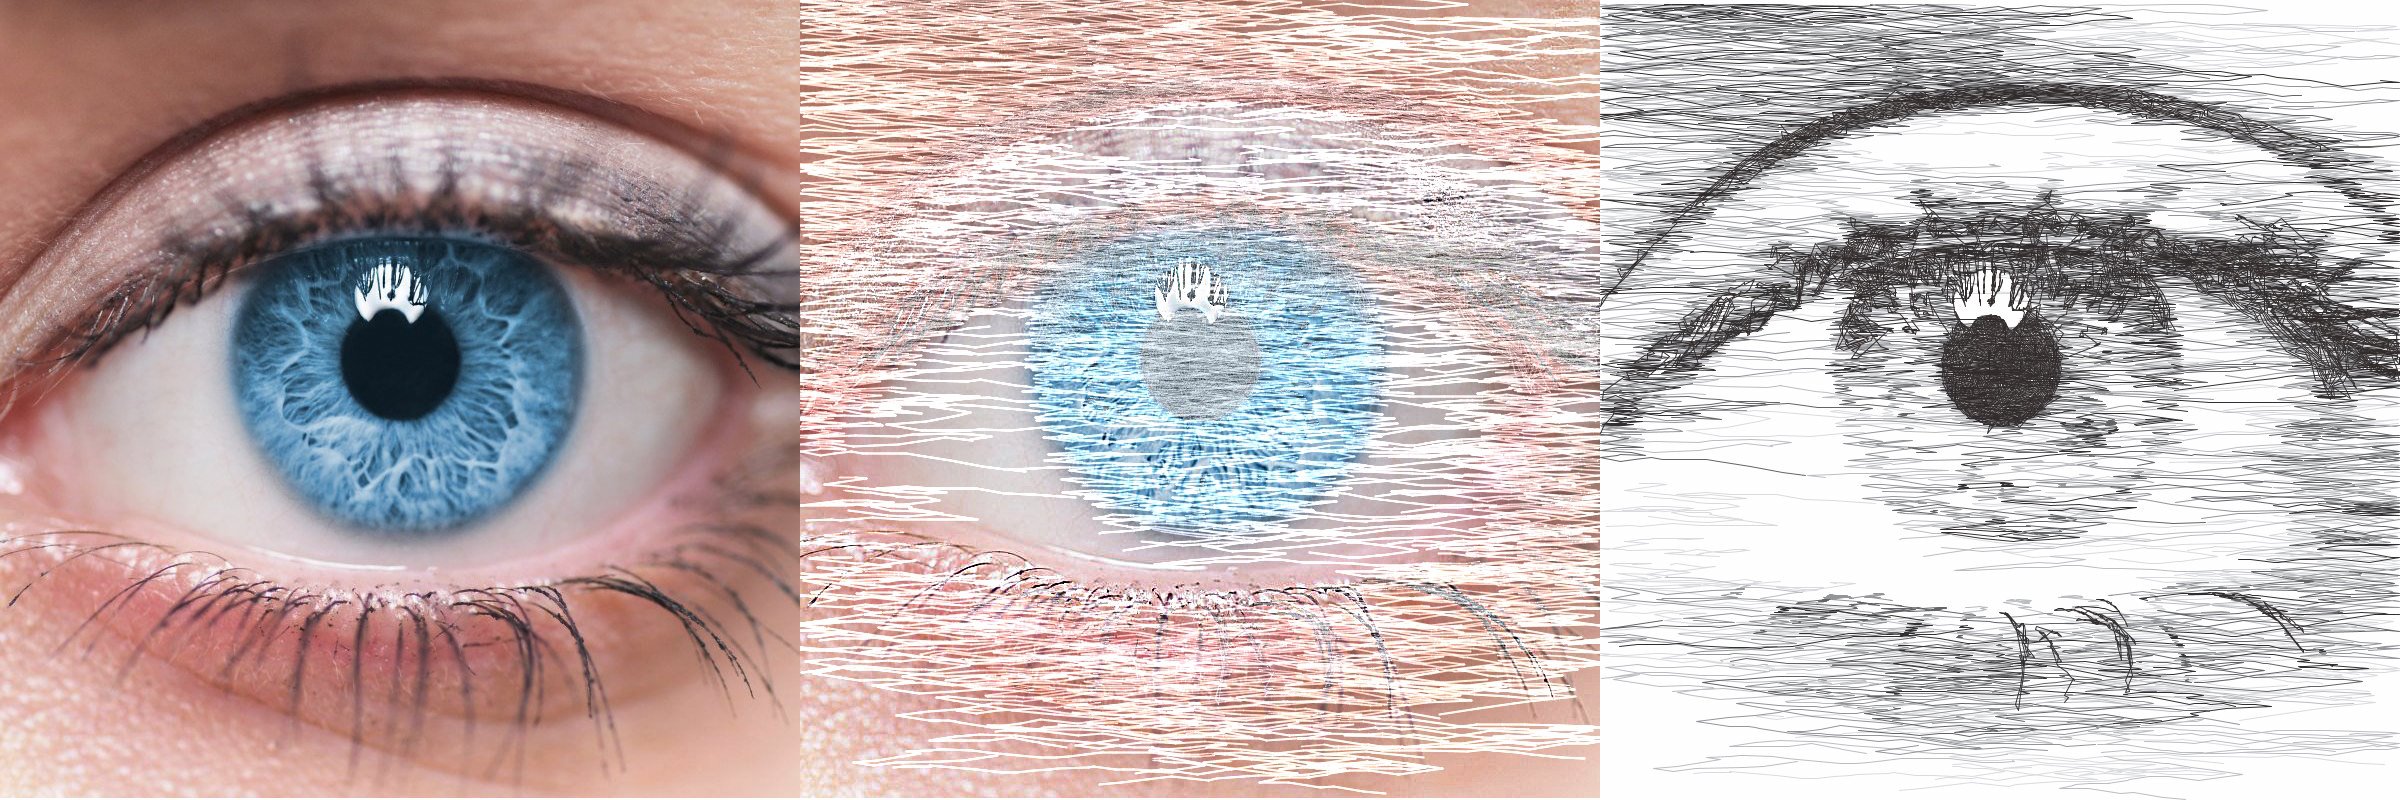
e.g. Fig 1. Original Image, Fig 2. Lightened/Erased Image, Fig 3. Sketch Lines Result - The “Digital” Preset was used with Erase Min = 1, Erase Max = 24
- Tone
Values: Percentage (Range: 0 -> 100)Controls the contrast of the Erasing process, by controlling a tone curve between the Erase Min / Erase Max & Erase Radius Min / Erase Radius Max.
Using a higher Tone will result in an image with a stronger contrast, with more overlap and less spacing between lines.
Note: The tone slider has no effect when the Erase Values are identical.
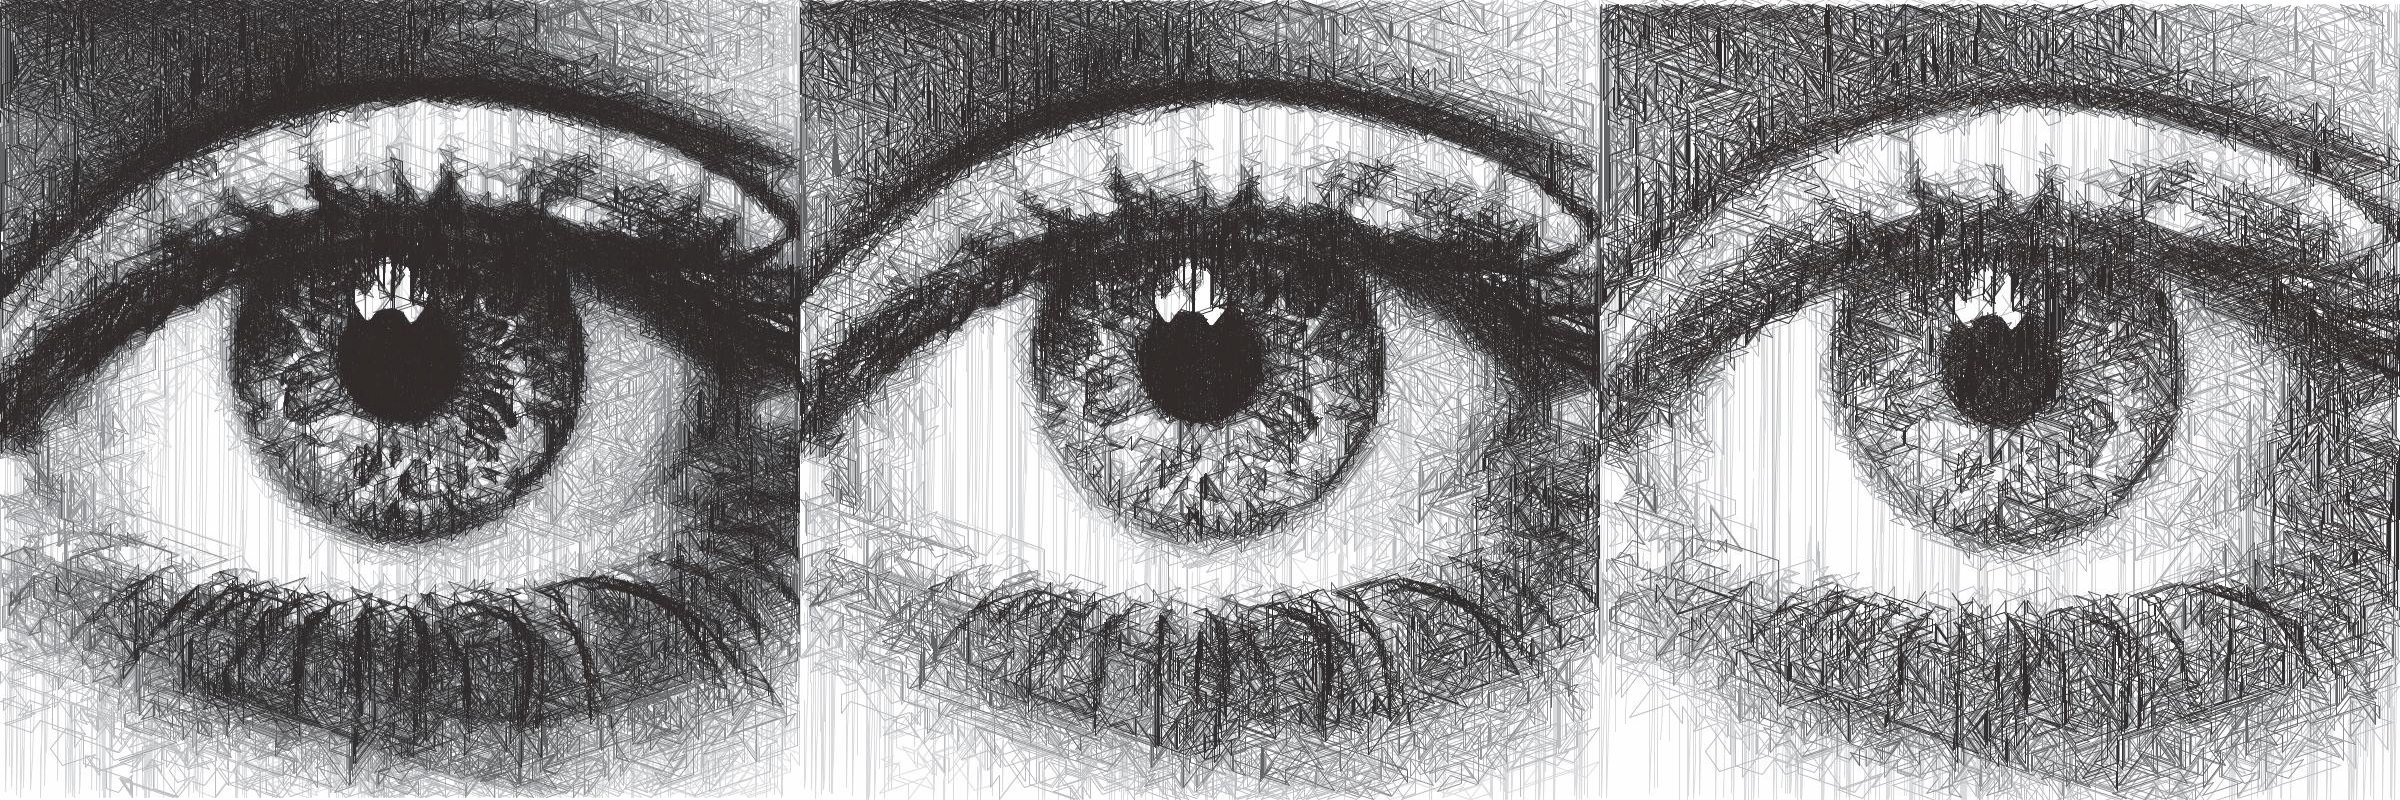
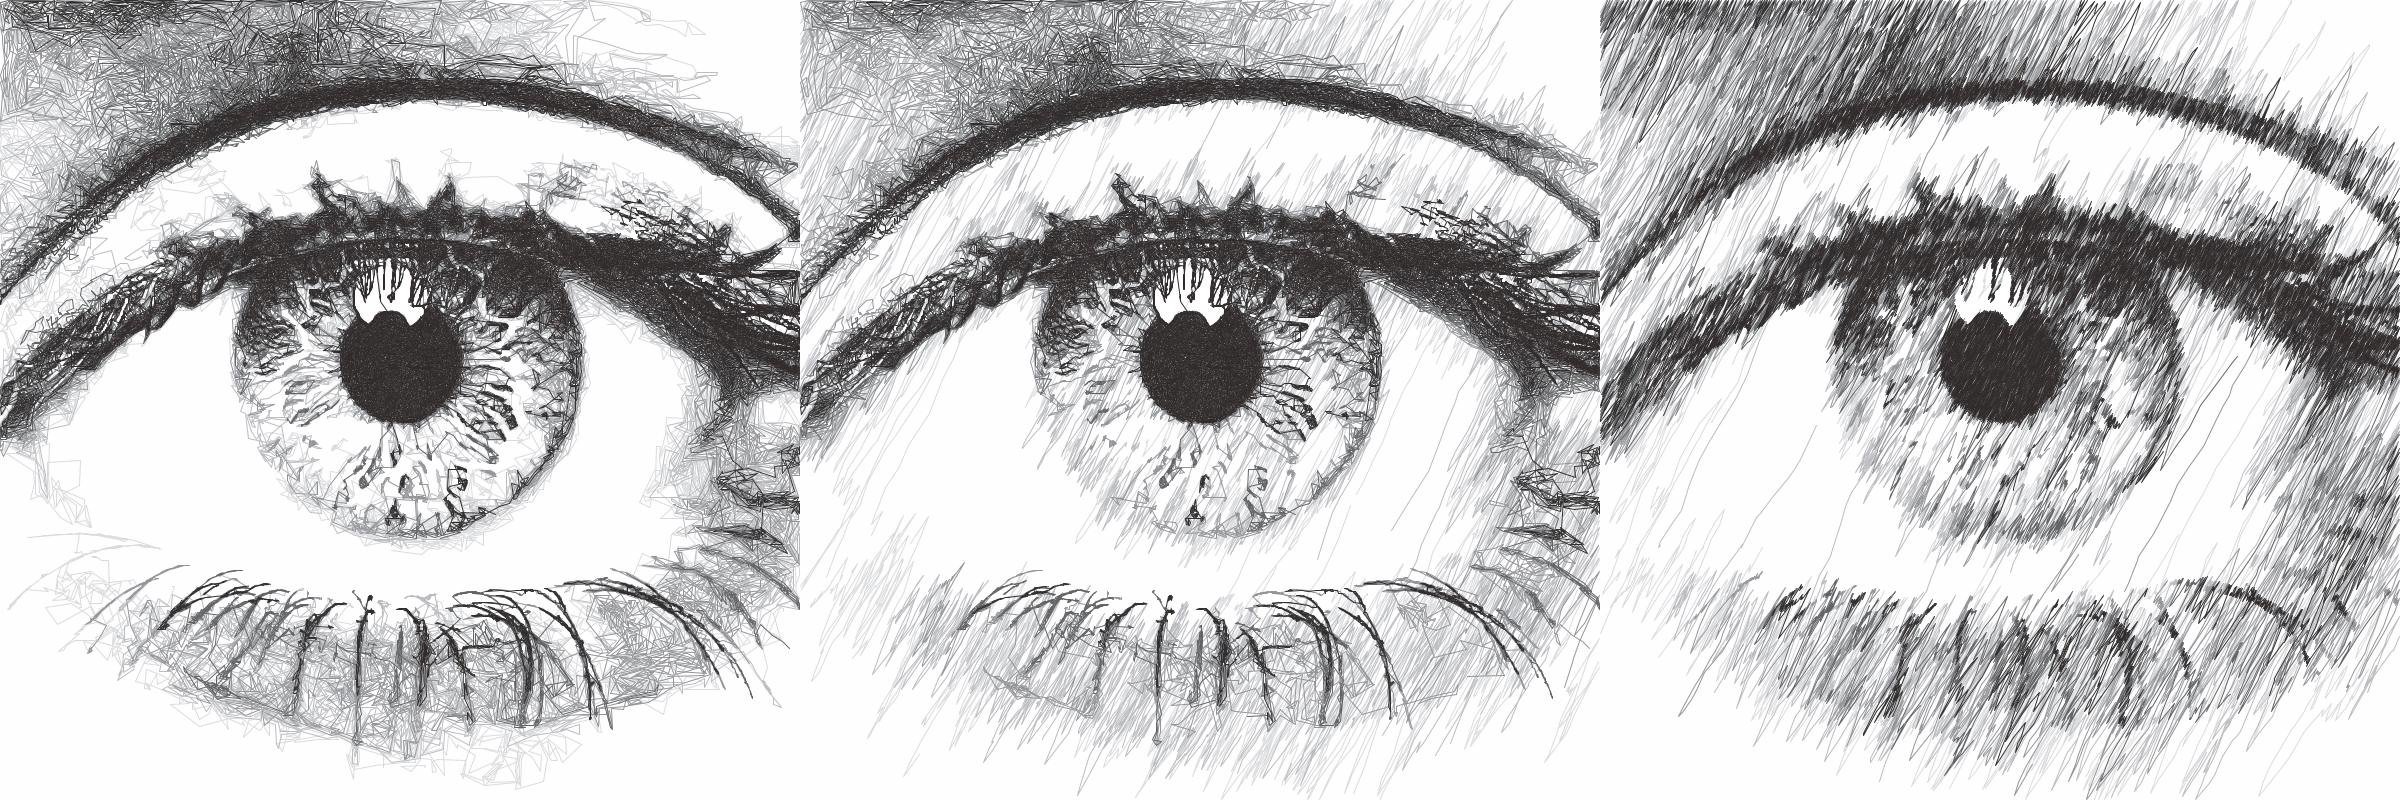
e.g. Fig 1. Tone=0, Fig 2. Tone=50, Fig 3. Tone=100 - The “Sketchy” Preset was used with Erase Min=50, Erase Max=125, Erase Radius Min=1.0, Erase Radius Max=6.0
Quick Tip: Use a tone of 100 when using a high Erase Radius Max, to bring some detail back into the image
Shading
- Shading
Values: Boolean (True | False)When True, shading segments will be drawn across the drawing which can only travel in the direction defined by the Start Angle Min & Max
- Start Angle Min
Values: Number (Range: -360 -> 360)Controls the minimum angle when shading, see Start Angle Max for more details.
- Start Angle Max
Values: Number (Range: -360 -> 360)Controls the maximum angle when __`Shading`, effectively changing the direction of the __`Shading` Process, it will have less effect when __`Shading` is disabled unless the Drawing Delta Angle isn’t set to 360, then the angle of the start angle will be more obvious.
e.g. Fig 1. Start Angle Min = -72, Max = -52, Fig 2. Start Angle Min = -85, Max = 95, Fig 3. Start Angle Min = 0, Max = 0 - created with the “Default” preset with Shading = True, Shading Threshold = 0
- Shading Threshold
Values: Percentage (Range: 0 -> 100)The point in the processing when the shading process will begin, effectively controlling the percentage of the drawing which is created from the shading process.
Note: It ignores Line Density, so if the limit is reached before the shading threshold is reached no shading will be seen.
e.g. Fig 1. Shading=False, Fig 2. Shading=True, Shading Threshold=50, Fig 3. Shading=True, Shading Threshold=100
- Shading Delta Angle
Values: Number (Range: -360 -> 360)Controls the directions that the PFM can travel during the Shading Process.
Changing this will result in much more “Glitchy” results, and is especially good for digital art!
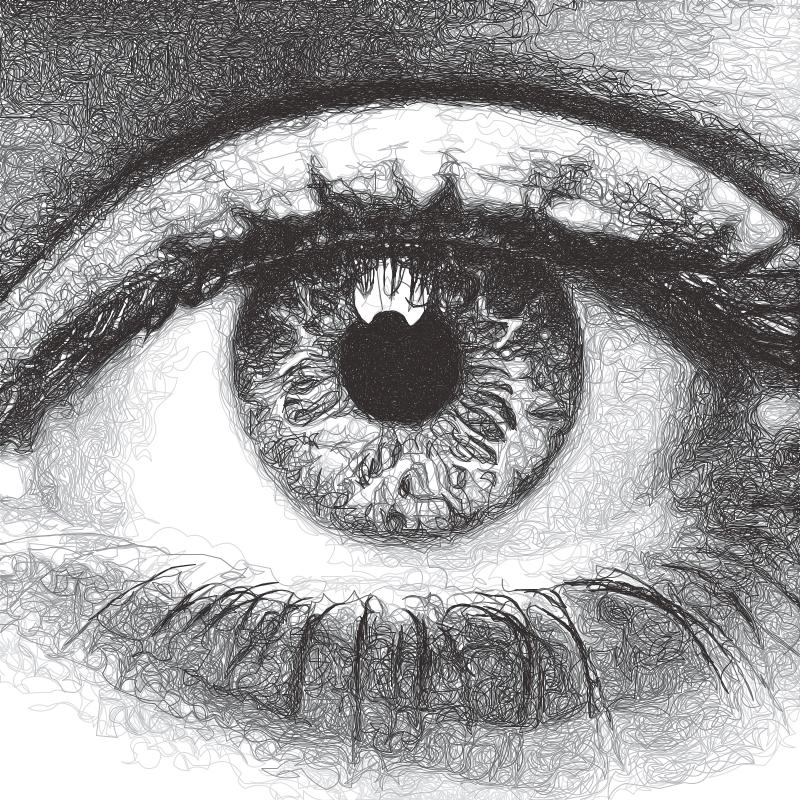
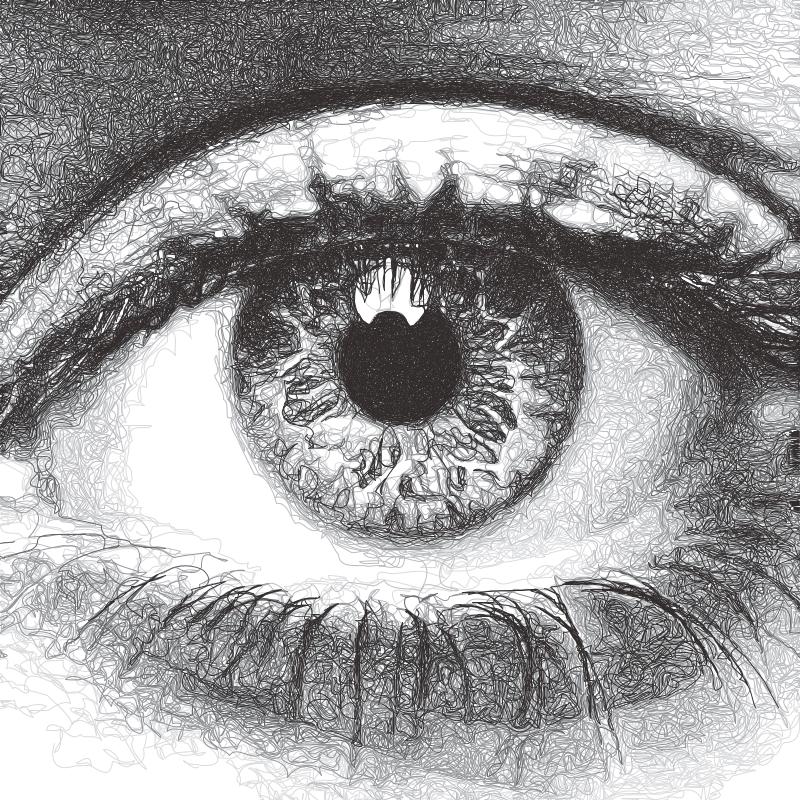
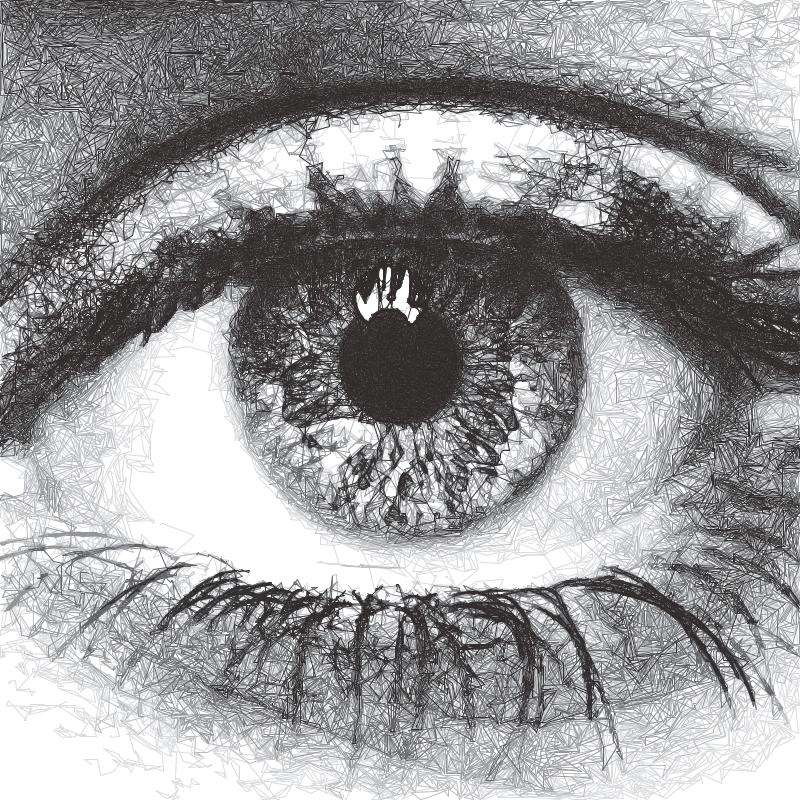
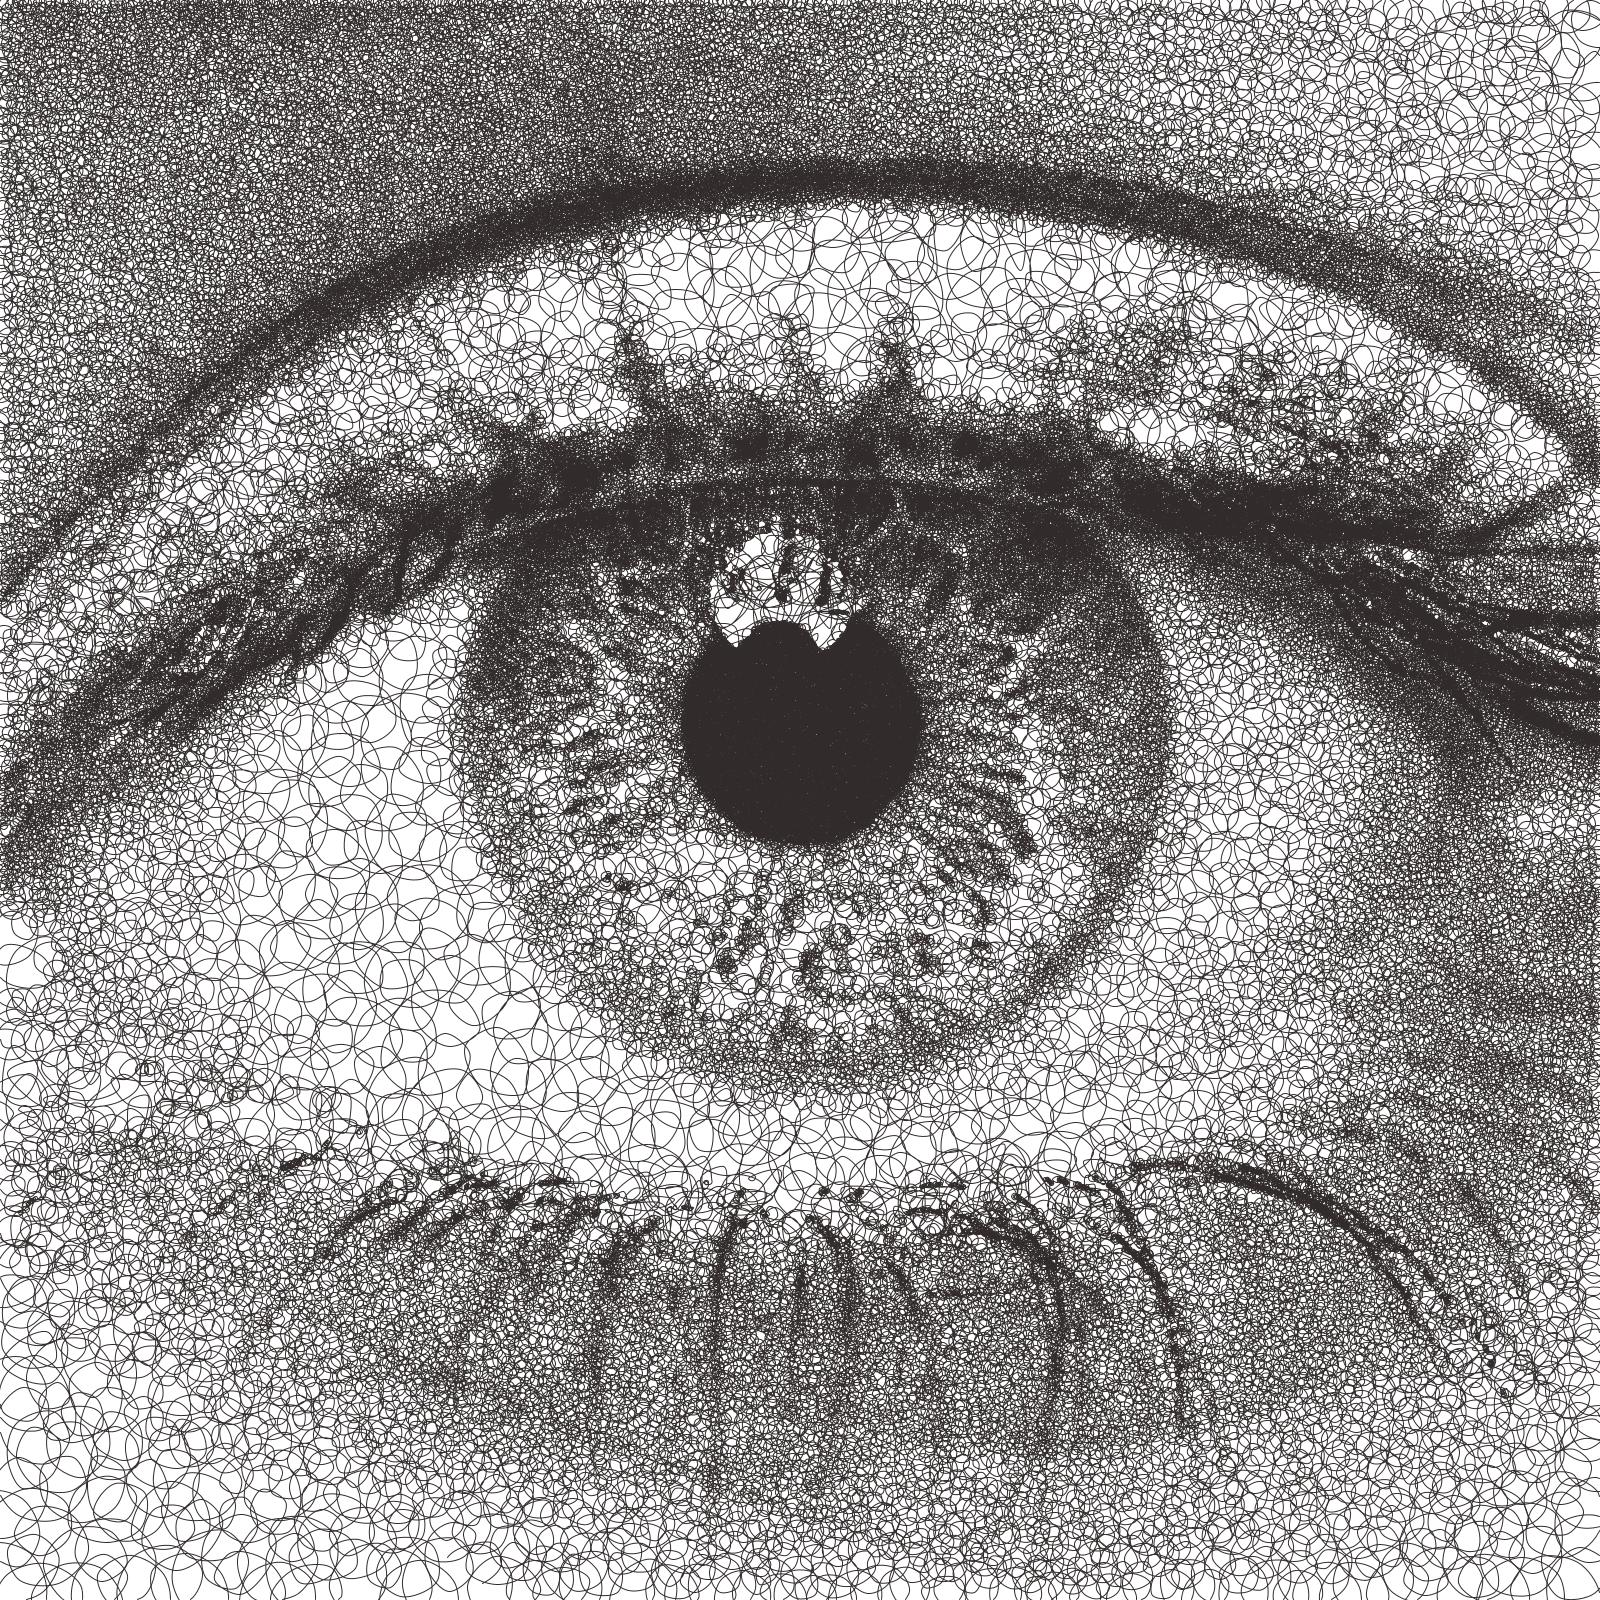
Sketch Curves
Transforms an image into catmull-rom splines using brightness data.
Settings
Curves
- Curve Tension
Values: Number (Range: 0.01 -> 1.0)Affects the tension of the catmull-rom splines
0.0 = No Tension, unpredictable curves
0.5 = Medium Tension, smooth curves
1.0 = Maximum tension, straight lines.
Sketch Squares
Transforms an image into lines in a rectangular pattern using brightness data.
Settings
Squares
- Start Angle
Values: Number (Range: -360 -> 360)Affects the rotation of the squares, useful to alter the results without dramatically changing the form of the squares.
Sketch Quad Beziers
Transforms an image into Quadratic Bézier curves using brightness data, by first finding the darkest line and then finding the darkest position for one control point. It uses more accurate “Bresenham” calculations which results in increased precision but longer processing times.
Settings
Curves (Quad Beziers)
- Curve Tests
Values: Number (Range: 1 -> 45)the number of positions to test for each control point to find the darkest curve, increasing this will result in a more accurate plot.
- Curve Variation
Values: Number (Range: 1 -> 1000)the maximum magnitude of the curve. Increasing this will decrease the test accuracy and increase the control point’s offsets.
- Curve Offset
Values: Number (Range: -100 -> 100)Allow you to control the ‘wiggle’ of the curve by defining the maximum offset the control’s points can move from the initial segment.
For Sketch Quad Beziers, this is a single control which controls the variation of the central point of each quad segment.
For Sketch Cubic Beziers, this is an A & B Offset which each control the variation of the A & B control points on the cubic segment.
- + Inherits settings from:
Sketch Cubic Beziers
Transforms an image into Cubic Bézier curves using brightness data, by first finding the darkest line and then finding the darkest position for the two control points. It uses more accurate “Bresenham” calculations which results in increased precision but longer processing times.
Settings
- + Inherits settings from:
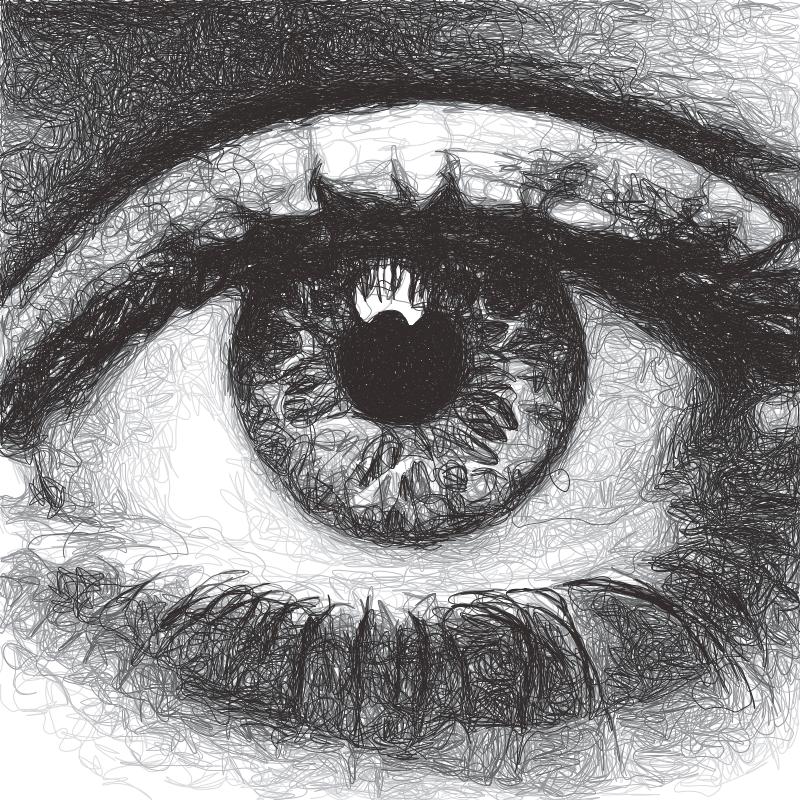
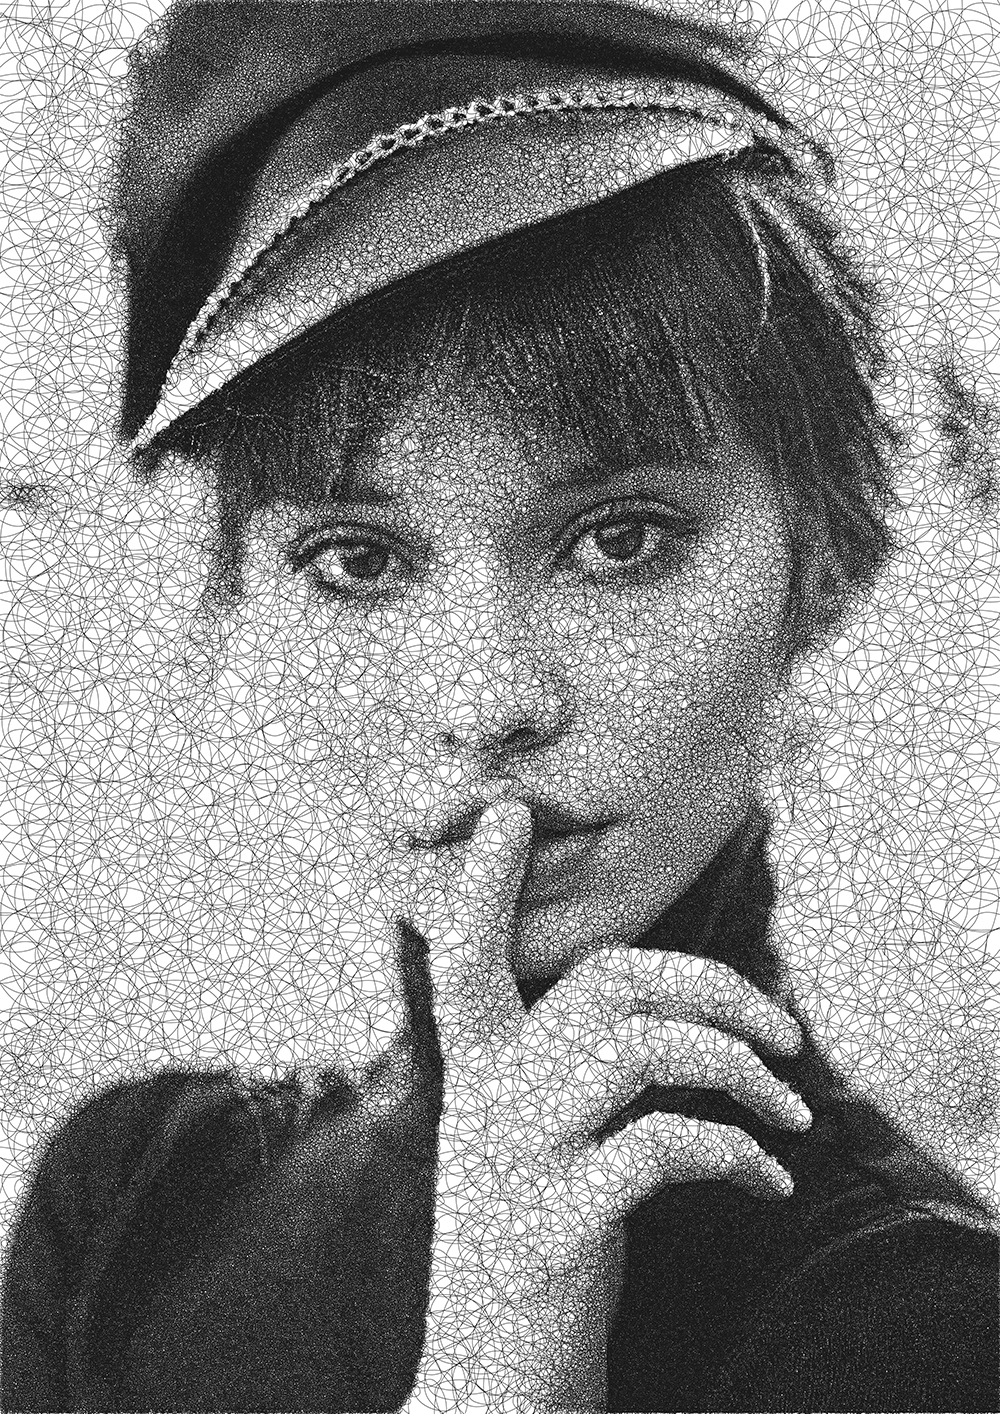
Sketch Catmull-Roms
Transforms an image into catmull-rom splines using brightness data, by finding the next darkest curve from each point. It uses more accurate “Bresenham” calculations which results in increased precision but longer processing times.
Settings
- + Inherits settings from:
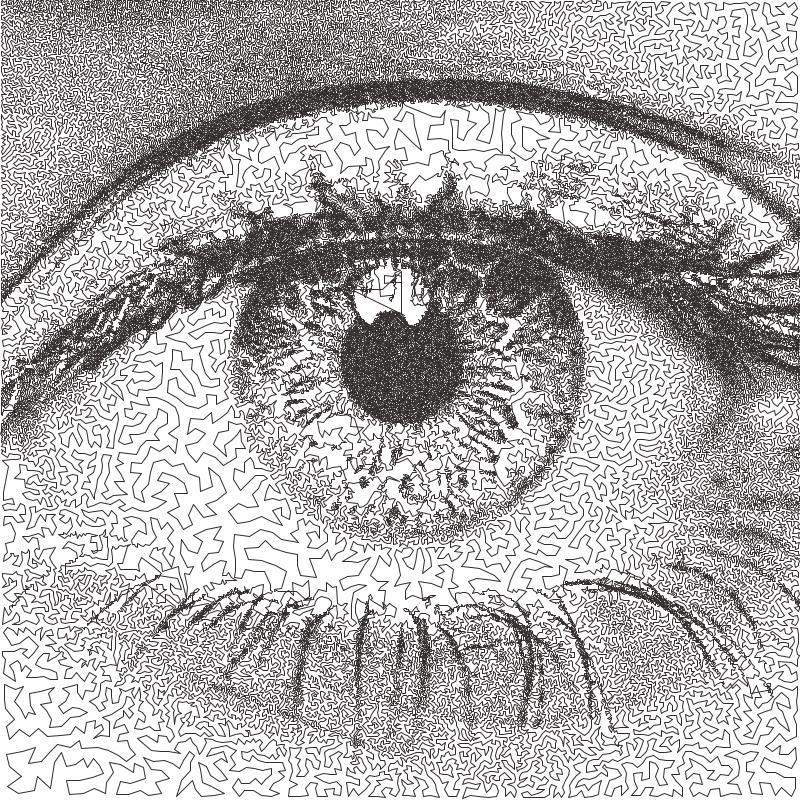
Sketch Shapes
Transforms an image into shapes using brightness data. It has the following modes: Rectangle and Ellipse.
Settings
Shapes (Sketch Shapes)
- Shape Type (Sketch Shapes)
Values: Rectangles | EllipsesAllows you to choose the type of shapes to create the drawing with.
Rectangles: All of the rectangles will be linked by sharing a corner segment, which means this setting is still fast to plot.
Ellipses: All ellipses will end in similar positions but won’t be linked so will require more pen lifts. May change in the future.
- + Inherits settings from:
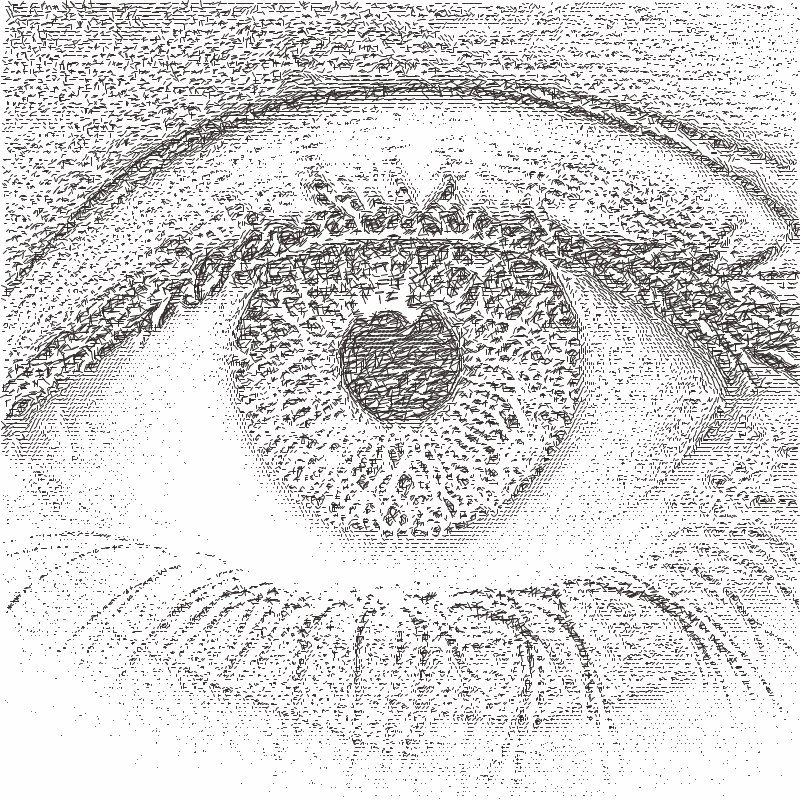
Sketch Sobel Edges
Transforms an image into lines using brightness & edge detection data. By using a Sobel Operator to find edges and then using this data in conjunction with the brightness to find the next line.
Settings
Sobel
- Sobel Intensity
Values: Number (Range: 0 -> 10)The priority of edge detection vs brightness
- Sobel Adjust
Values: Number (Range: 0 -> 255)Similar to __`Erasing`, the amount to decrease a pixel’s sobel value by when a line is drawn over it, affects how strongly the PFM is affected by the sobel values.
- + Inherits settings from:
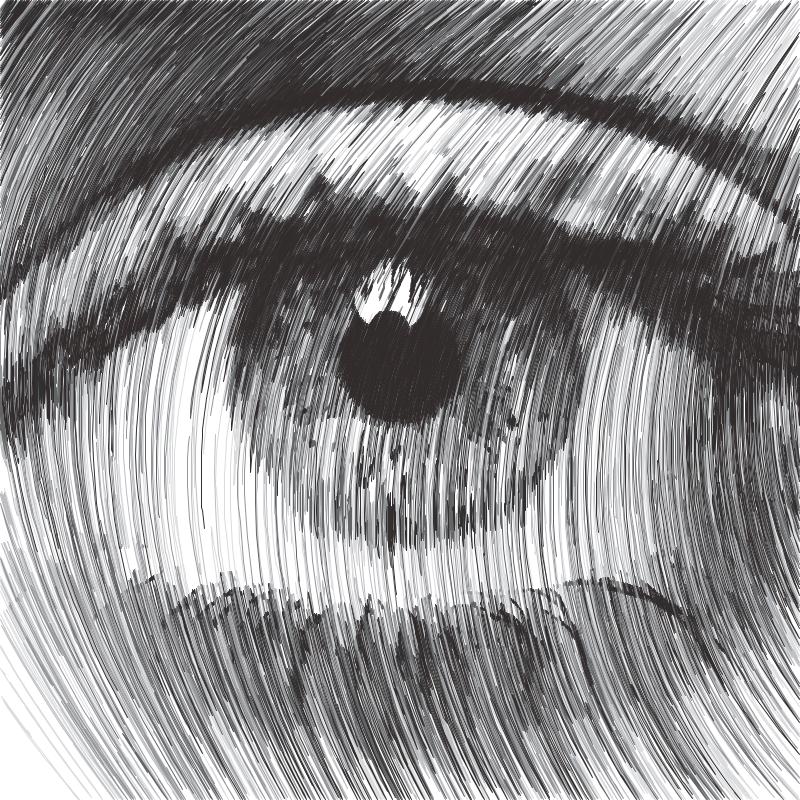
Sketch Waves
Transforms an image into lines which follow the direction defined by an X and Y curve function.
Settings
Waves
- Start Angle (Sketch Waves)
Values: Number (Range: -360 -> 360)Affects the rotation of the waves, useful to alter the results without dramatically changing the form of the waves.
- Wave Offset X/Y
Values: Number (Range: -1000 -> 100)Shifts the X/Y wave across the image.
- Wave Divisor X/Y
Values: Number (Range: -1000 -> 1000)Affects the intensity of the X/Y wave, increasing the divisor will result in flatter waves, decreasing it will result in more exaggerated waves
- Wave Type X/Y
Values: Sin | Cos | TanChanges the mathematical function used to create the wave.
- + Inherits settings from:
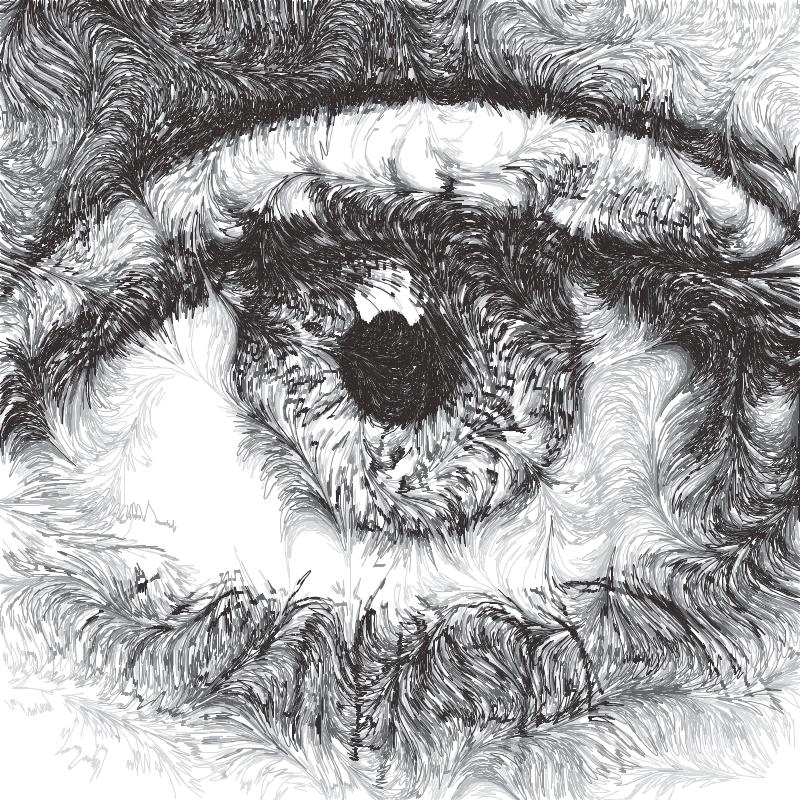
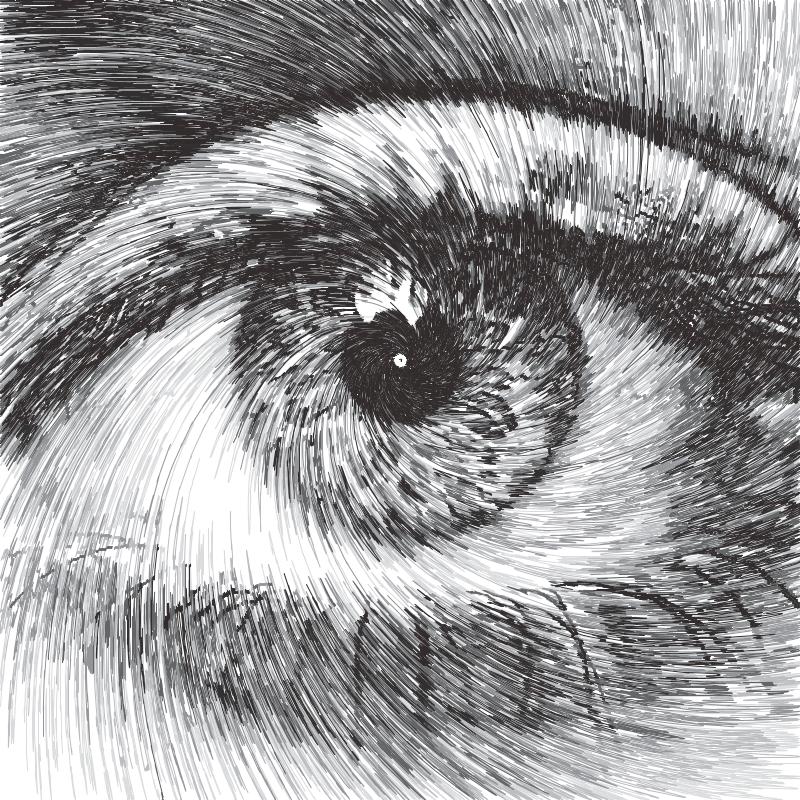
Sketch Flow Field
Transforms an image into lines which follow the direction defined by a “Flow Field”
Settings
Default Flow Field Settings
- Start Angle (Flow Field)
Values: Number (Range: -360 -> 360)Controls the initial angle of the Flow Field, rotating the resulting field
- X Frequency (Flow Field)
Values: Number (Range: 0.001 -> 4)Controls the rate of change on the X Axis of the flow field, higher frequency = more detailed flow field
- Y Frequency (Flow Field)
Values: Number (Range: 0.001 -> 4)Controls the rate of change on the Y Axis of the flow field, higher frequency = more detailed flow field
- Scale Frequency (Flow Field)
Values: Number (Range: 0.01 -> 20)Allows you to scale the X Frequency (Flow Field) and Y Frequency (Flow Field) uniformly, a quick way to alter the detail of the resulting flow field
- Amplitude (Flow Field)
Values: Number (Range: 0.0 -> 1.0)Controls the amplitude / influence of the resulting flow field, a low amplitude will converge the flow fields closer to the Start Angle (Flow Field)
- + Inherits settings from:
Sketch Superformula
Transforms an image into lines which follow a Superformula
Settings
Default Superformula Settings
- Start Angle (Superformula)
Values: Number (Range: -360 -> 360)Controls the rotation of the shape/field generated by the Superformula
- Centre X/Y (Superformula)
Values: Number (Range: 0.0 -> 100.0)Controls the origin point of the superformula, expressed as a percentage of the images width/height, allowing you to easily move the generated patterns across the image.
- X/Y Scale (Superformula)
Values: Number (Range: 1 -> 20)Allows you to scale the shape/field generated by the Superforumla, essentially zooming into the generated pattern.
- Frequency (Superformula)
Values: Number (Range: 0.0 -> 20.0)Controls the variation of the Superformula pattern around the centre point, equivalent to the m parameter in the superformula equation.
- Curvature (Superformula)
Values: Number (Range: 0.0 -> 80.0)Controls the smoothing between the frequencies generated around the centre point, equivalent to the n1 parameter in the superforumla equation.
- Sine/Cos Factor (Superformula)
Values: Number (Range: 0.0 -> 80.0)Controls variation in the X/Y axis, equivalent to the n2 & n2 parameters in the superforumla equation.
- + Inherits settings from:
Sketch Sweeping Curves
This PFM is focused on creating long sweeping curves which are more natural / human-like, focused on creating longer curves. Unlike other Curve PFMs which sometimes turn sharply, Sweeping curves will gently change direction. This makes this PFM really excellent for figures, portraits and curved objects.
Settings
Curves (Sweeping Curves)
- Curvature
Values: Number (Range: 0 -> 1.0)Controls the appearance of “knots” in the curve, it will make a greater visual difference at extreme changes in direction which Sketch Sweeping Curves tries to avoid so the difference will be subtle.
0 = Uniform Catmull-Rom
0.5 = Centripetal Catmull-Rom (Default)
1.0 Chordal Catmull-Rom
- + Inherits settings from:
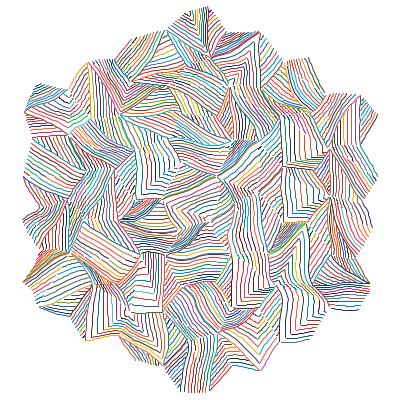
5.2. Streamline PFMs
Streamline PFMs generate streamlines to represent an image which are driven by the direction from a vector field. The streamlines are spaced according to the brightness of the image without overlapping. The underlying vector field can be altered dramatically to create many different styles which still remaining faithful to the original images brightness. This makes them very versatile for creating stylised wave like patterns which can be highly customised.
They are also suitable for single or multi-pen plots, and CMYK or Colour Match plots.
By default Streamline PFMs use the “Luminance Weighted” pen distribution creating multi-pen plots which distribute the streamlines based on their luminance.
Default Streamline Settings
Streamlines
- Min Spacing
Values: Number (Safe Range: 0.5 -> 20.0)Controls the minimum spacing between the generated streamlines, see Tone (Streamlines PFMs)
- Max Spacing
Values: Number (Safe Range: 2.0 -> 50.0)Controls the maximum spacing between the generated streamlines, see Tone (Streamlines PFMs)
- Min Length
Values: Number (Safe Range: 0 -> 20.0)Controls the minimum length of the generated streamlines
- Max Length
Values: Number (Safe Range: 0 -> 500.0)Controls the maximum length of the generated streamlines
- Tone (Streamlines PFMs)
Values: Number (Safe Range: 0 -> 100.0)Controls the contrast of the generated streamlines, by controlling a tone curve between the Min Spacing / Max Spacing.
- Distortion (Streamlines PFMs)
Values: Number (Safe Range: 0 -> 100.0)Controls the random distortion of the generated streamlines, allowing more hand-drawn like streamlines to be generated
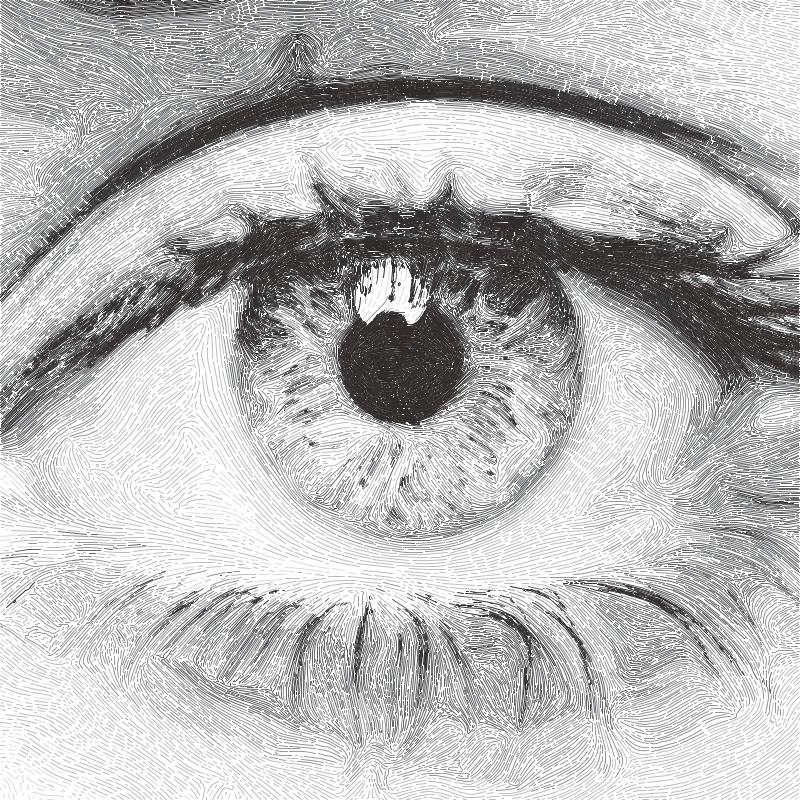
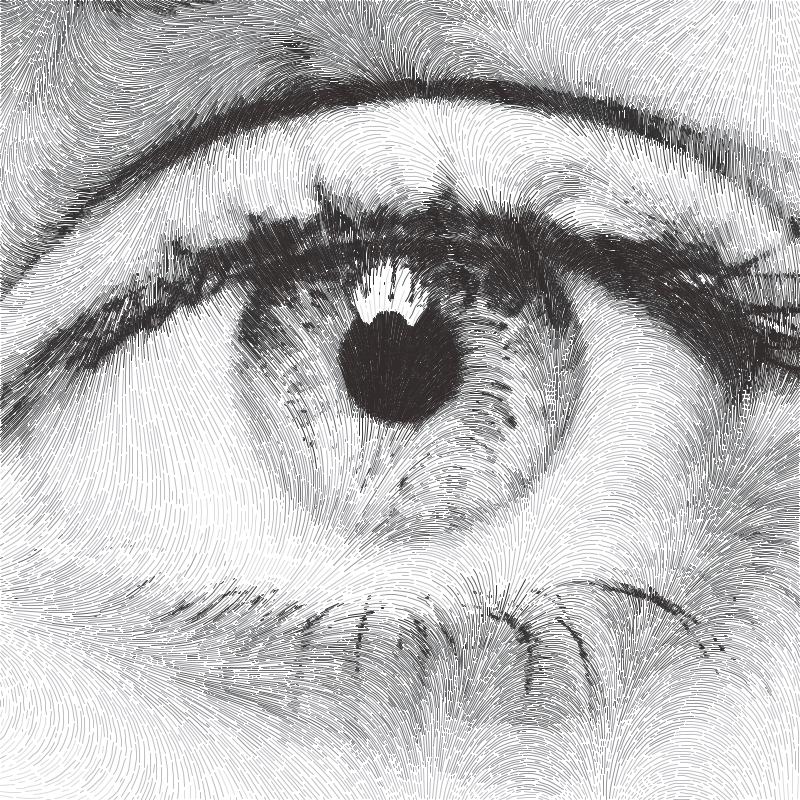
Streamlines Edge Field
Generates streamlines based on the natural direction of an image as described by an “Edge Tangent Flow” vector field and an optional “Flow Field” vector field.
Settings
- + Inherits settings from:
Edge Tangent Flow
- Edge Power (Streamlines Edge Field)
Values: Number (Safe Range: 0.0 -> 100.0)Controls the influence of the Edge Tangent Flow and instead favour the underlying Flow Field. A value of 100 will ignore the flow field, a value of 50 will be influenced equally by the “Edge Field” and the “Flow Field”
- ETF Iterations
Values: Number (Safe Range: 0.0 -> 100.0)Controls the number of refinement operations to perform on the Edge Tangent Flow. The refinement steps are required in order to allow the ETF to converge towards the best edge directions, many iterations will result in a very smooth Edge Field creating long sweeping streamlines which may lose small details, too few iterations may result in artifacts and shorter streamlines
- ETF Radius
Values: Number (Safe Range: 3.0 -> 30.0)Controls the size of the kernel to be used when refining the ETF and therefore the number of pixels to compare (ETF Radius of 9 -> 9x9 = 81 pixels), a lower radius will compute faster but may contain more artifacts caused by noise in the original image, a larger radius will take longer to process and may lose small details.
- Post Blur Iterations
Values: Number (Safe Range: 0.0 -> 50.0)Controls the number of post blur operations to perform on the Edge Tangent Flow after refinement. Adding post blur will remove detail from the Edge Field but create aesthetically pleasing results.
Quick Tip: Try out the “Fingerprints” preset which uses Post Blur iterations to create it’s effect.
- Post Blur Radius
Values: Number (Safe Range: 0.0 -> 50.0)Controls the size of the kernel used in the post blur operation
Streamlines Flow Field
Generates streamlines based on a “Flow Field” vector field.
Settings
- + Inherits settings from:
Streamlines Superformula
Generates streamlines based on a Superformula vector field.
Settings
- + Inherits settings from:
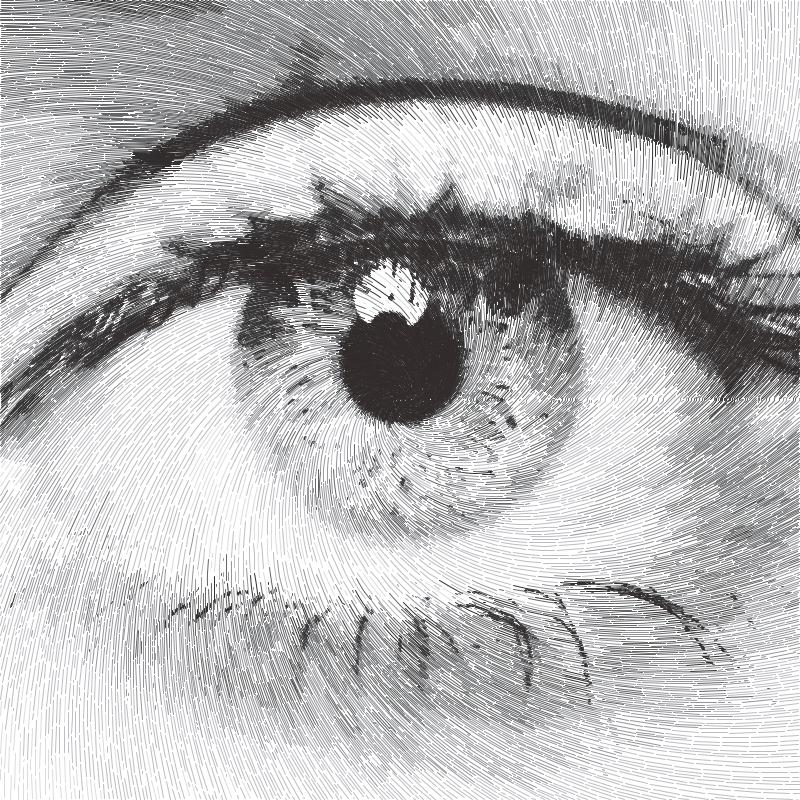
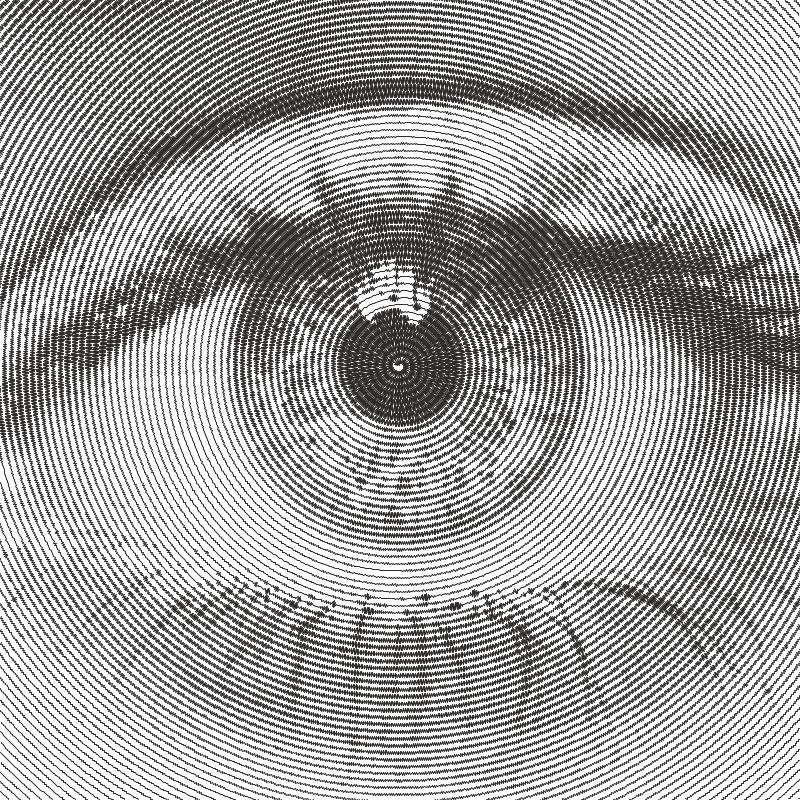
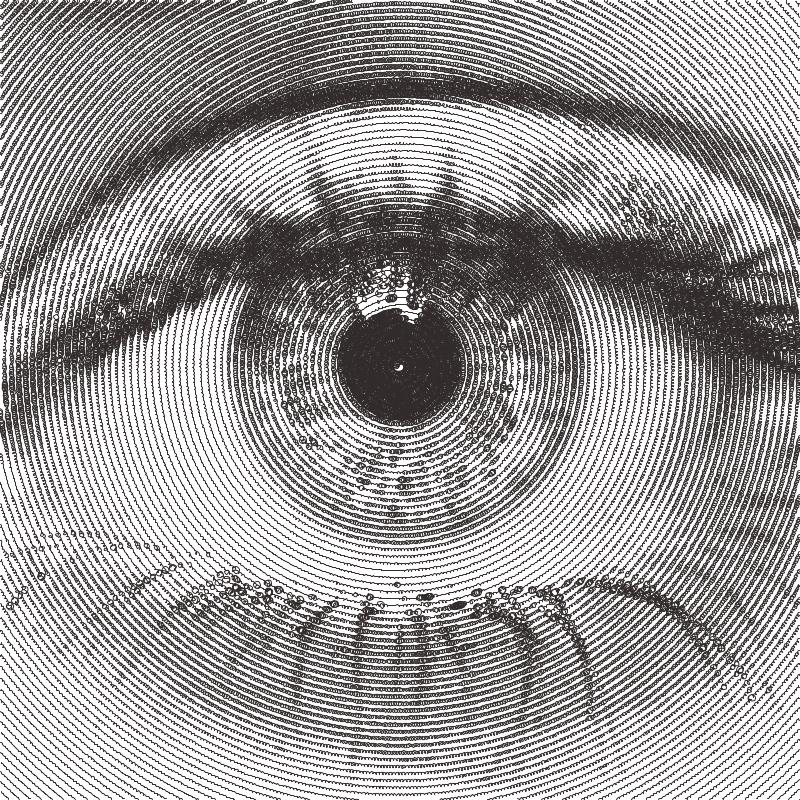
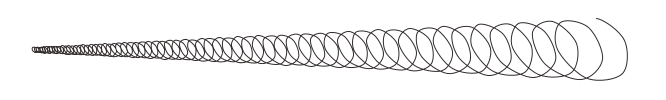
5.3. Spiral PFMS
Spiral PFMs are suitable for plots with a single pen, and can generate spirals which are continuous without any pen lifts.
With a small Ring Spacing they can also be very accurate and represent small details in the original image.
How they work
Moves to the first point on the spiral.
Samples the brightness at the current point and draws a line which is perpendicular to the spiral where the line’s length is proportional to the sampled brightness.
Move to the next point on the spiral and Repeat step 2.
The process stops when the specified Spiral Size has been reached
Default Spiral Settings
Spiral
- Spiral Type
Values: Archimedean | ParabolicChanges the style of the generated Spiral
Archimedean: a single spiral
Parabolic: two connected spirals, this can be used for creating a spiral out of two different pens. Change your Distribution Type to “Preconfigured” after processing has finished.
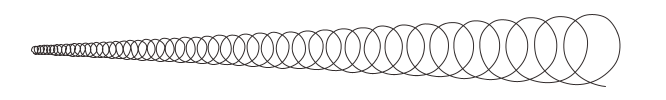
- Spiral Size
Values: Number (Safe Range: 0 -> 100)Alters where the generated spiral will end. A spiral at 100% will always reach the corner of the image.
Quick Tip: You can adjust the Spiral Size after the drawing has been generated with the Shapes Slider.
- Centre X/Y
Values: Number (Safe Range: 0 -> 100)Controls the centre position the spiral starts from as percentages relative to the images width/height.
e.g. Left = 0, Middle = 50, Right = 100
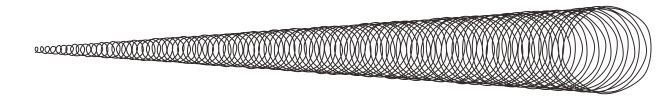
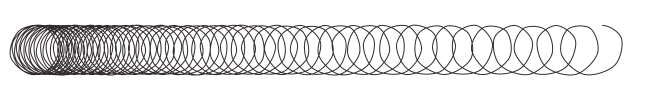
- Ring Spacing
Values: Number (Safe Range: 0 -> 50)The distance between each generated ring, which also has the effect of increasing the width of the rings as the Amplitude (Spiral PFMs) is proportional to the Ring Spacing.
A lower Ring Spacing will resolve more detail from the original image.
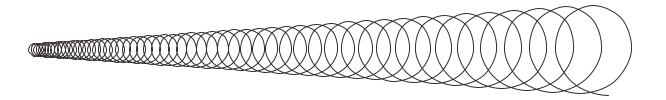
- Amplitude (Spiral PFMs)
Values: Number (Safe Range: 0.01 -> 2.0)Controls the scaling of the lines/shapes generated along the spiral. It is proportional to the Ring Spacing
\(finalWidth = ringSpacing * (amplitude)\)
- Variable Velocity
Values: Boolean (True | False)When True, the velocity will vary between the Min & Max proportionally to the image’s luminance.
When False, the Min Velocity will always be used.
- Min/Max Velocity (Spiral PFMs)
Values: Number (Safe Range: 1.0 -> 360.0)Controls the frequency of shapes along the spiral. Lower velocities will result in more shapes, higher will result in less.
The velocity variables should be used to adjust the overall contrast of the spiral (adding a contrast filter in Image Processing is a good place to start too).
Higher velocity = less shapes generated, lower plotting time. High values will result in more inconsistent results as the spiral generation may skip of key areas of the image.
Lower velocity = more shapes generated, higher plotting time. More accurate to the original image.
\(velocity = minVelocity + sineFunction(luminance) * (maxVelocity-minVelocity)\)
- Ignore White (Spiral PFMs)
Values: Boolean (True | False)When True, if the spiral reaches a white pixel in the source image the spiral will not be drawn.
When False, the spiral will draw over the entire image up to the Spiral Size.
Spiral Sawtooth
Transforms an image into a oscillating spiral.
Settings
Spiral
- Connected Lines (Spiral Sawtooth)
Values: Boolean (True | False)When True, the generated lines will be connected and if the spiral finishes within the boundaries of the paper the final drawing will have no pen lifts.
When False, every generated line along the spiral will be disconnected.
Spiral Circular Scribbles
Transforms an image into a oscillating spiral.
Settings
- + Inherits settings from:
Adaptive Circular Scribbles (some settings are hidden)
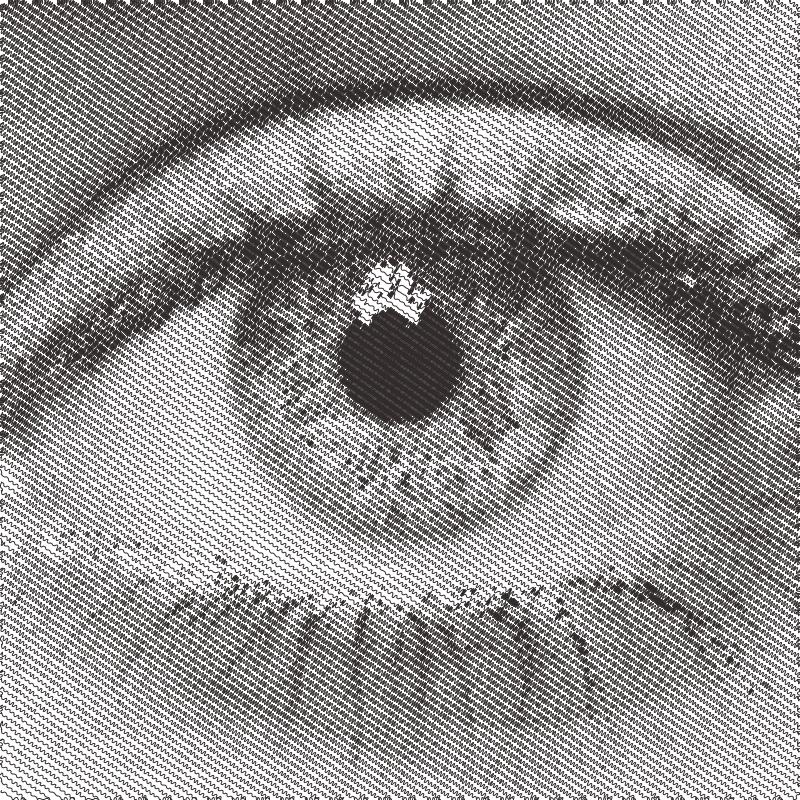
5.4. Hatch PFMs
Hatch PFMs generate a set of lines across the image and then use different styles to turn these lines into waves/scribbles whose width matches the luminance at a given point.
They are suitable for plots with a Single Pen and similarly to Spiral PFMs can generate continuous hatched lines across the drawing which don’t require any pen lifts.
Default Hatch Settings
Hatching
- Line Spacing
Values: Number (Safe Range: 2.0 -> 50.0)Controls the spacing of the generated lines.
- Angle
Values: Number (Safe Range: 2.0 -> 50.0)Controls the angle of the generated lines.
- Crosshatch
Values: Boolean (True | False)When True, an additional set of lines will be generated travelling perpendicular to the current angle, creating a crosshatched effect.
- Link Ends
Values: Boolean (True | False)When True, the ends of the generated lines will be linked, creating a plot which doesn’t require any pen lifts.
Hatch Sawtooth
Uses an oscillating wave of varying velocity to create a set of lines
Settings
Sawtooth
- Amplitude (Hatch Sawtooth)
Values: Number (Safe Range: 0.01 -> 2.0)Controls the scaling of the shapes generated along the lines. It is proportional to the Line Spacing.
\(finalWidth = lingSpacing * (amplitude)\)
- Min/Max Velocity (Hatch Sawtooth)
Values: Number (Safe Range: 1.0 -> 360.0)Controls the frequency of shapes along the generated lines. Lower velocities will result in more shapes, higher will result in less.
Similar to Min/Max Velocity in Spiral PFMs
\(velocity = minVelocity + sineFunction(luminance) * (maxVelocity-minVelocity)\)
- Curve Tension (Hatch Sawtooth)
Values: Number (Safe Range: 0.0 -> 1.0)See Sketch Curves
- + Inherits settings from:
Hatch Circular Scribbles
Settings
- + Inherits settings from:
5.5. Adaptive PFMS
‘Adaptive’ are named after the way they adapt to match the tone of the input image.
The reproduction of tones is considerably more accurate than other PFMs as they have an additional “Tone Mapping” processing stage. This process only needs to be performed once per configuration of settings. If you change a setting which could alter the tone map it will be generated again.
You can view the output of the tone mapping stage by selecting “Display:” and then “Tone Map”. This shows you three outputs; the Reference Tone Map, the drawing created by the PFM with the current settings and the blurred version of this output.
Adaptive PFMs are suitable for Single Pen Plots or Multi Colour Plots
For the best results with Adaptive PFMs use high resolution, high contrast images
How do they work?
Generate a Tone Map using steps 2 to 3, analyse the result then create a new input image which will result in drawing with a more accurate representation of the original tones.
Create evenly distributed points across the image based on brightness.
Generate the specific style based on these points.
Default Adaptive PFM Settings
Adaptive Sampling
- Min/Max Sample Radius (Adaptive PFMs)
Values: Number (Safe Range: 0.1 -> 100.0)Controls the distribution of the generated points, controlling the contrast and detail present in the final image.
In general keeping Min Sample Radius < 2 and changing the Max Sample Radius will provide the best results with more Adaptive PFMs.
Unlike LBG & Voronoi, Adaptive PFMs follow the sample sizes strictly and place points evenly across the entire image and produce a consistent looking drawing.
- Brightness (Adaptive PFMs)
Values: Number (Safe Range: 0.0 -> 2.0)Controls the brightness applied as a pre-processing step to the source image, see Contrast (Adaptive PFMs).
- Contrast (Adaptive PFMs)
Values: Number (Safe Range: 0.0 -> 2.0)Controls the contrast applied as a pre-processing step to the source image.
The quality of Drawings from Adaptive PFMs rely massively on contrast and brightness so these controls are included for simplicity, though they behave the same as adding a contrast filter in the Pre-Processing tab.
- Ignore White (Adaptive PFMs)
Values: Boolean (True | False)When True, points will not be placed in the white areas of the image.
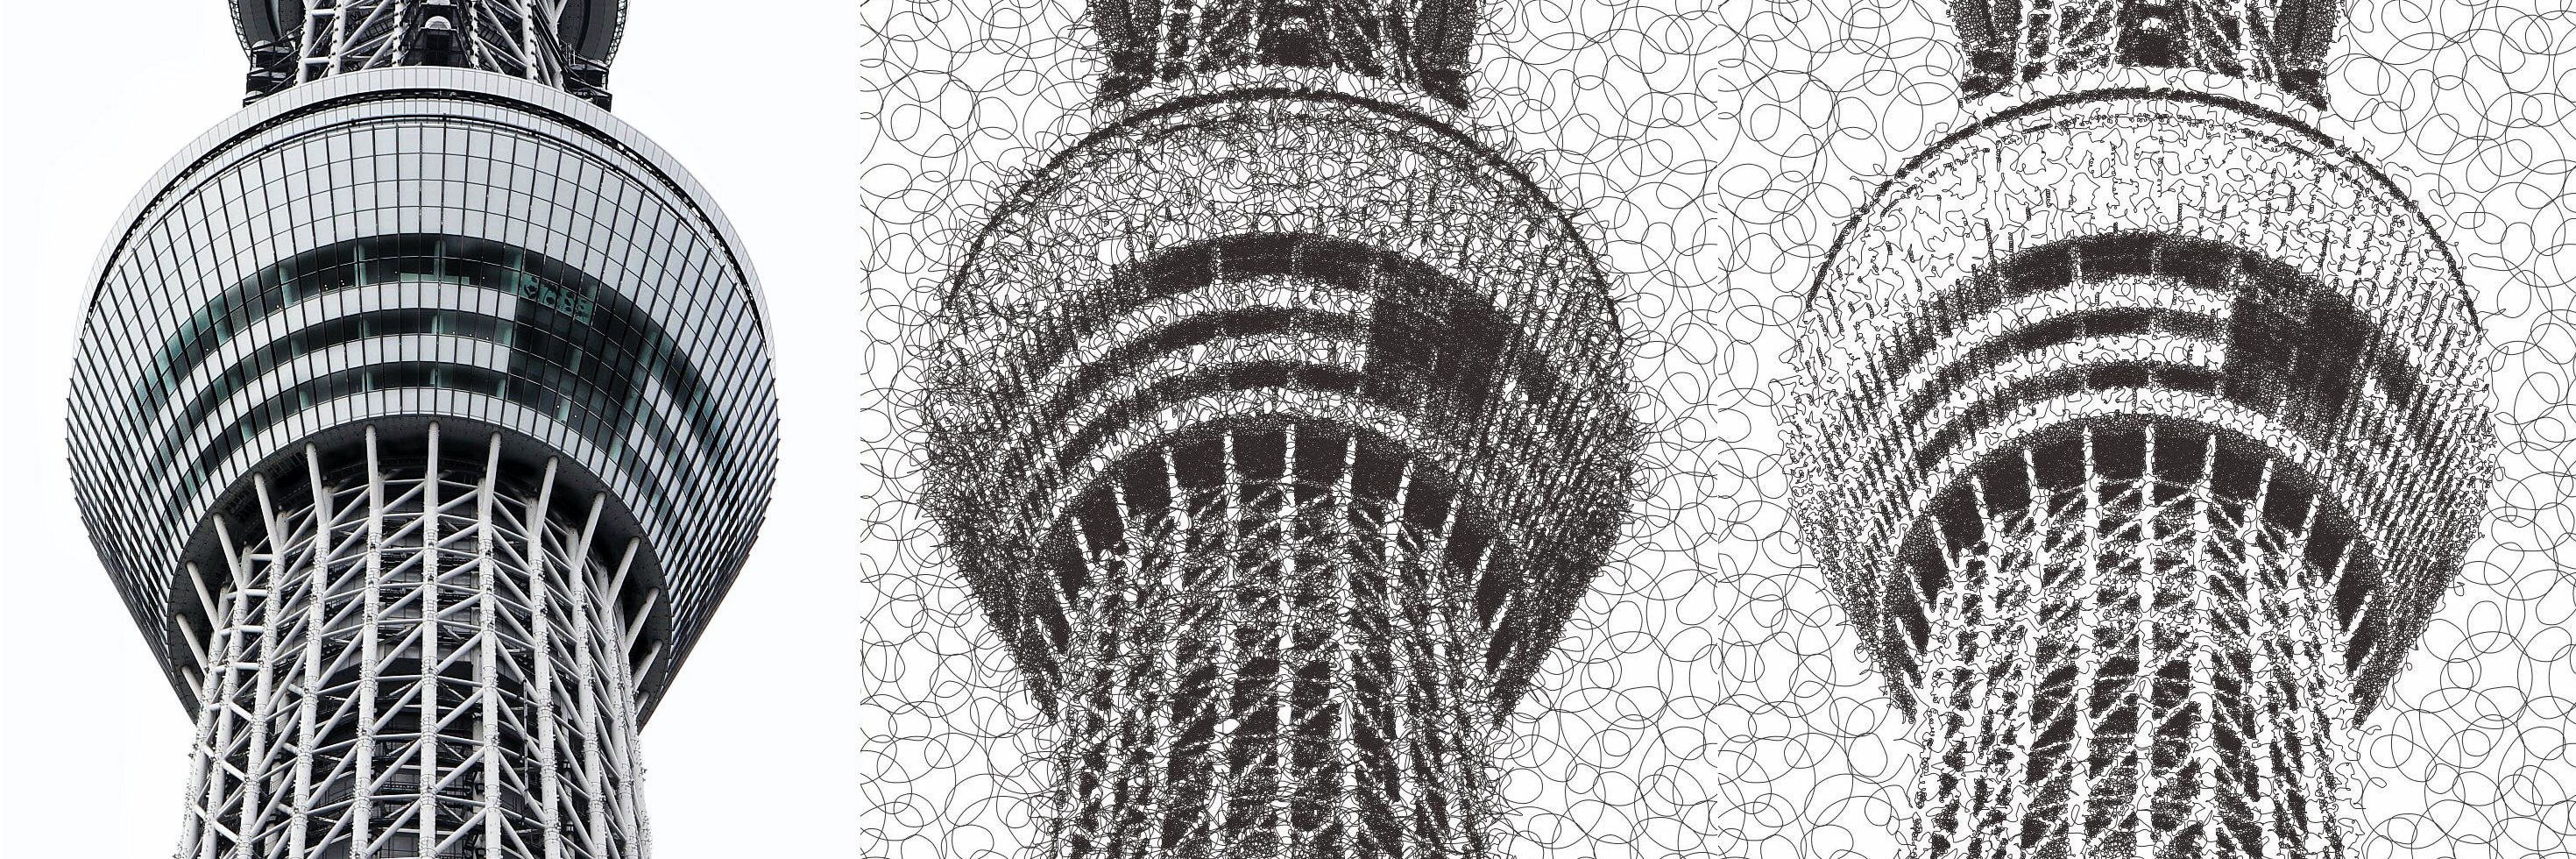
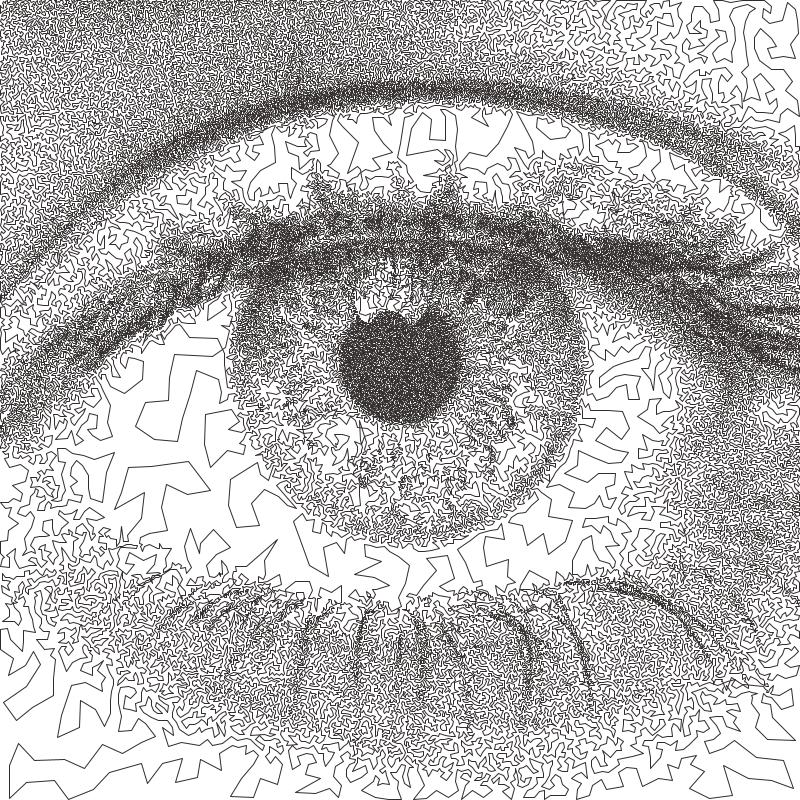
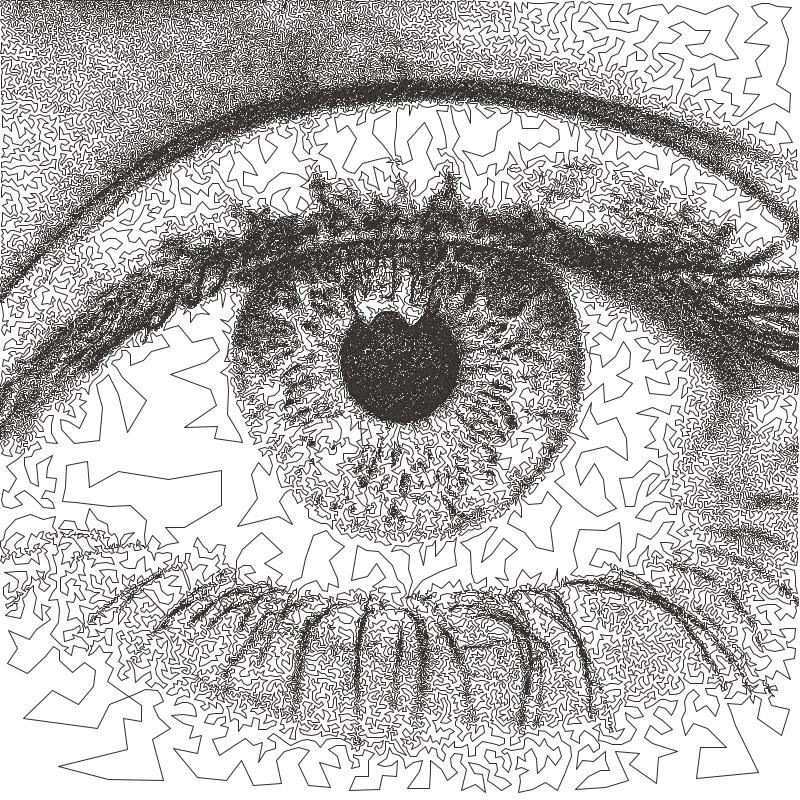
Adaptive Circular Scribbles
Transforms an image into a single continuous circular scribble.
This is an implementation of Chiu Et Al 2015, “Tone‐ and Feature‐Aware Circular Scribble Art”. If you wish to achieve results similar to Chiu Et Al’s implementation use a size of paper, pen width which gives you a plotting size of 4000px on the largest edge then use the “Chiu Et Al – 4000px” preset
Settings
Circular Scribbles
These settings are shared by Spiral Circular Scribbles, Adaptive Circular Scribbles and LBG Circular Scribbles
- Min/Max Radius (Circular Scribbles)
Values: Number (Safe Range: 0.1 -> 128)Controls the radius of the generated Circular Loops which make up the scribble. The radius will vary across the drawing based on the image’s luminance.
\(radius = minRadius + (luminance * (maxRadius-minRadius))\)
e.g - Circular Scribble varying from Min Radius to Max Radius
- Min/Max Velocity (Circular Scribbles)
Values: Number (Safe Range: 0.1 -> 128)Controls the min/max velocity of the generated Circular Scribbles, in other words this controls the frequency of circular loops in the final scribble. The radius will vary across the drawing based on the image’s luminance.
\(velocity = minVelocity + (luminance * (maxVelocity-minVelocity))\)
e.g - Circular Scribble varying from Min Velocity to Max Velocity
- Angular Velocity
Values: Number (Safe Range: 0.1 -> 180)Controls the speed of rotation of the scribbles. Low angular velocity will result in fewer loops, higher velocity will result in more loops. Generally the angular velocity should be at least double the maximum velocity if you wish the scribbles to always create loops. The default is generally good, but it can be useful to adjust it slightly for some images.
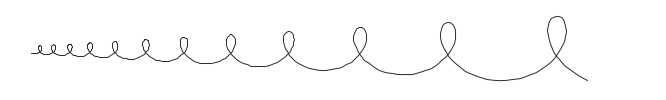
e.g. Angular Velocity = 10
e.g. Angular Velocity = 40
- Azimuth Angle Min/Max
Values: Number (Range: -180 -> 180)Controls the pitch of the circular scribbles, resulting in a slanting effect. Note: If you wish to introduce a regular slant keep the min/max the same.
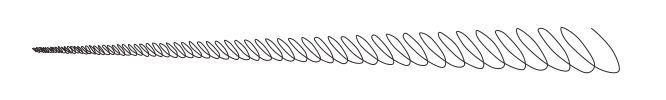
e.g. Azimuth Angle Min = 45 & Azimuth Angle Max = 45
- Polar Angle Min/Max
Values: Number (Range: -180 -> 180)Controls the yaw of the circular scribbles, resulting in closing/widening the circular loops Note: Similarly to Polar Angle, keeping the values the same will result in a consistent style.
e.g. Polar Angle Min = 45 & Polar Angle Max = 45
- Curvature (Circular Scribbles)
Values: Number (Range: 0 -> 1)Controls the interpolation between scribble points, 0 = Straight Lines -> 1 = Smooth Curves
e.g. Curvature = 0
e.g. Curvature = 1
- Edge Retention
Values: Boolean (True | False)When True, the radius of Circular Scribbles will be adapted to prevent them from overlapping the detected edges in the image, resulting in more detail being retained in the final drawing.
Set the Edge Threshold A & B, to alter the number of edges detected.
Comparison: Fig 1. Original Image, Fig 2. Default Settings, Fig 3. Default Settings w/ Edge Retention=True
- Edge Threshold A & B
Values: Number (Range: 1F -> 255F)These thresholds are used by the internal Canny Edge Detector to filter out the target edges. Raising the threshold will reduce the effect of the edge retention.
From the OpenCV documentation
If a pixel gradient is higher than the upper threshold, the pixel is accepted as an edge
If a pixel gradient value is below the lower threshold, then it is rejected.
If the pixel gradient is between the two thresholds, then it will be accepted only if it is connected to a pixel that is above the upper threshold.
Canny recommended an upper:lower ratio between 2:1 and 3:1.
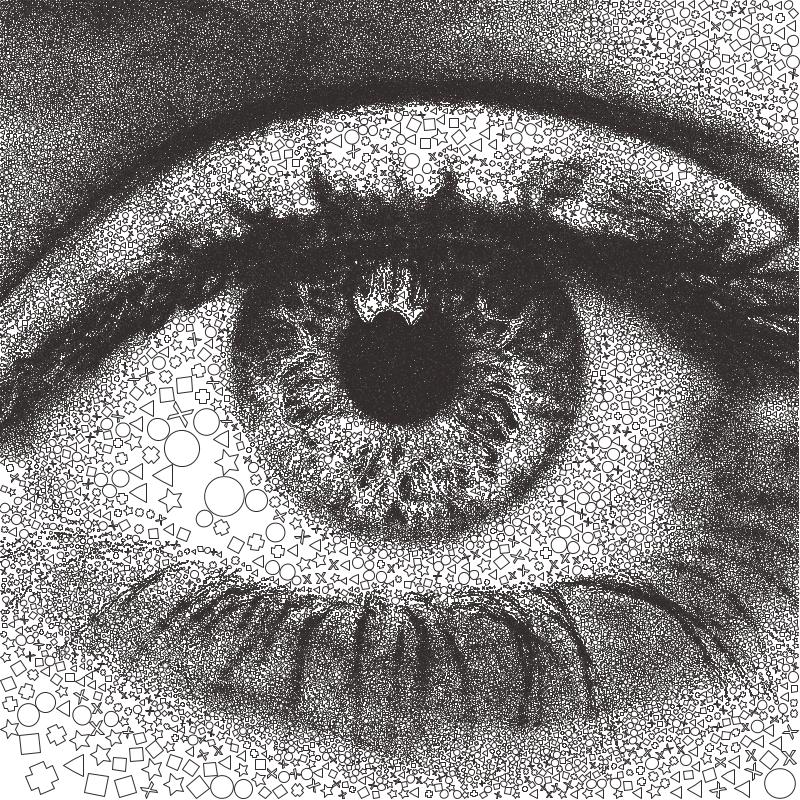
Adaptive Shapes
Transforms an image into a series of packed shapes
Settings
Shapes
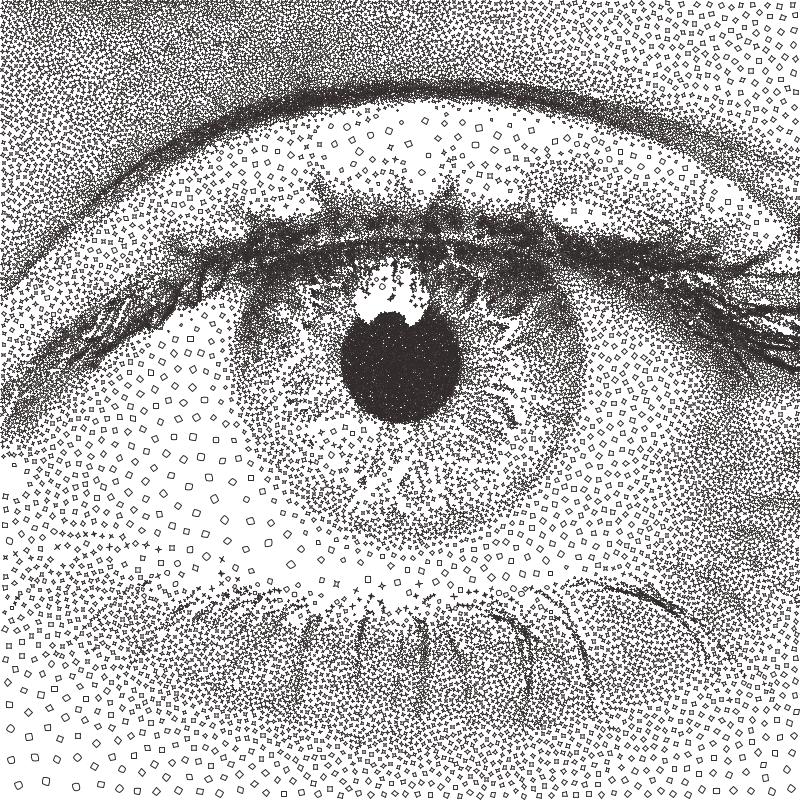
- Shape Type (Adaptive Shapes)
Values: Circle | Square | Star | Triangle | Cross | Multiply | LP Space | RandomControls the shape type generated at each sample point, most are self-explanatory with the exception of LP Space which uses
Circle: generates circles
Square: generates squares
Star: generates 5 pointed stars
Triangle: generates triangles
Cross: generates a thick cross
Multiply: generates the outline of a multiply symbol
LP Space: roughly imitates the LP Space/p-norm function to create shapes which vary from Diamond -> Circle -> Rounded Square. This shape type can better represent the tonality of the original image by adjusting its shape to match. It also produces more variety in the final drawing.
Random: chooses randomly from the other shape types each time a shape is generated, the resulting shapes can be altered by changing the Random Seed
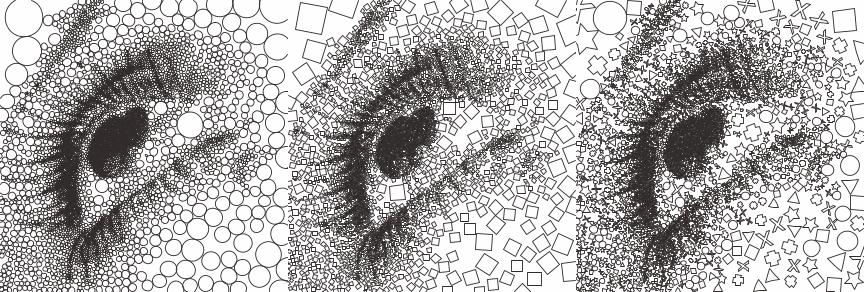
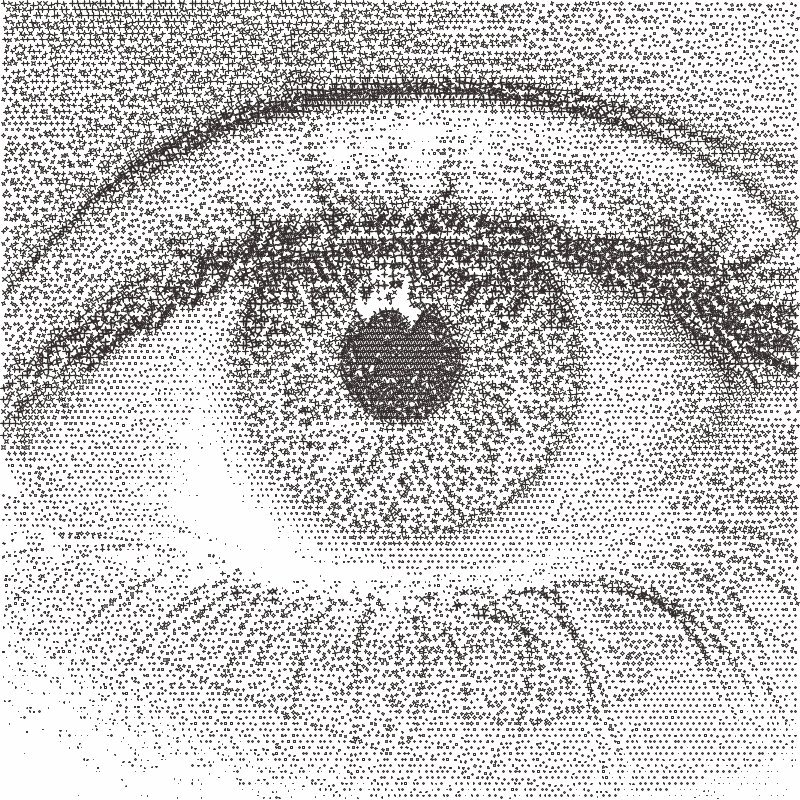
Fig 1. Circle (Default), Fig 2. Square, Fig 3. Random
- Align Rotation (Adaptive Shapes)
Values: Boolean (True | False)When True, the rotation of the shapes will follow the natural direction of the image, the Min/Max Rotation will be ignored.
When False, the rotation of the shapes will be a random angle between the Min/Max Rotation.
- Min/Max Rotation (Adaptive Shapes)
Values: Number (Safe Range: 0 -> 360)Controls the min/max rotation of the generated shapes.
Used when Align Rotation is set to False.
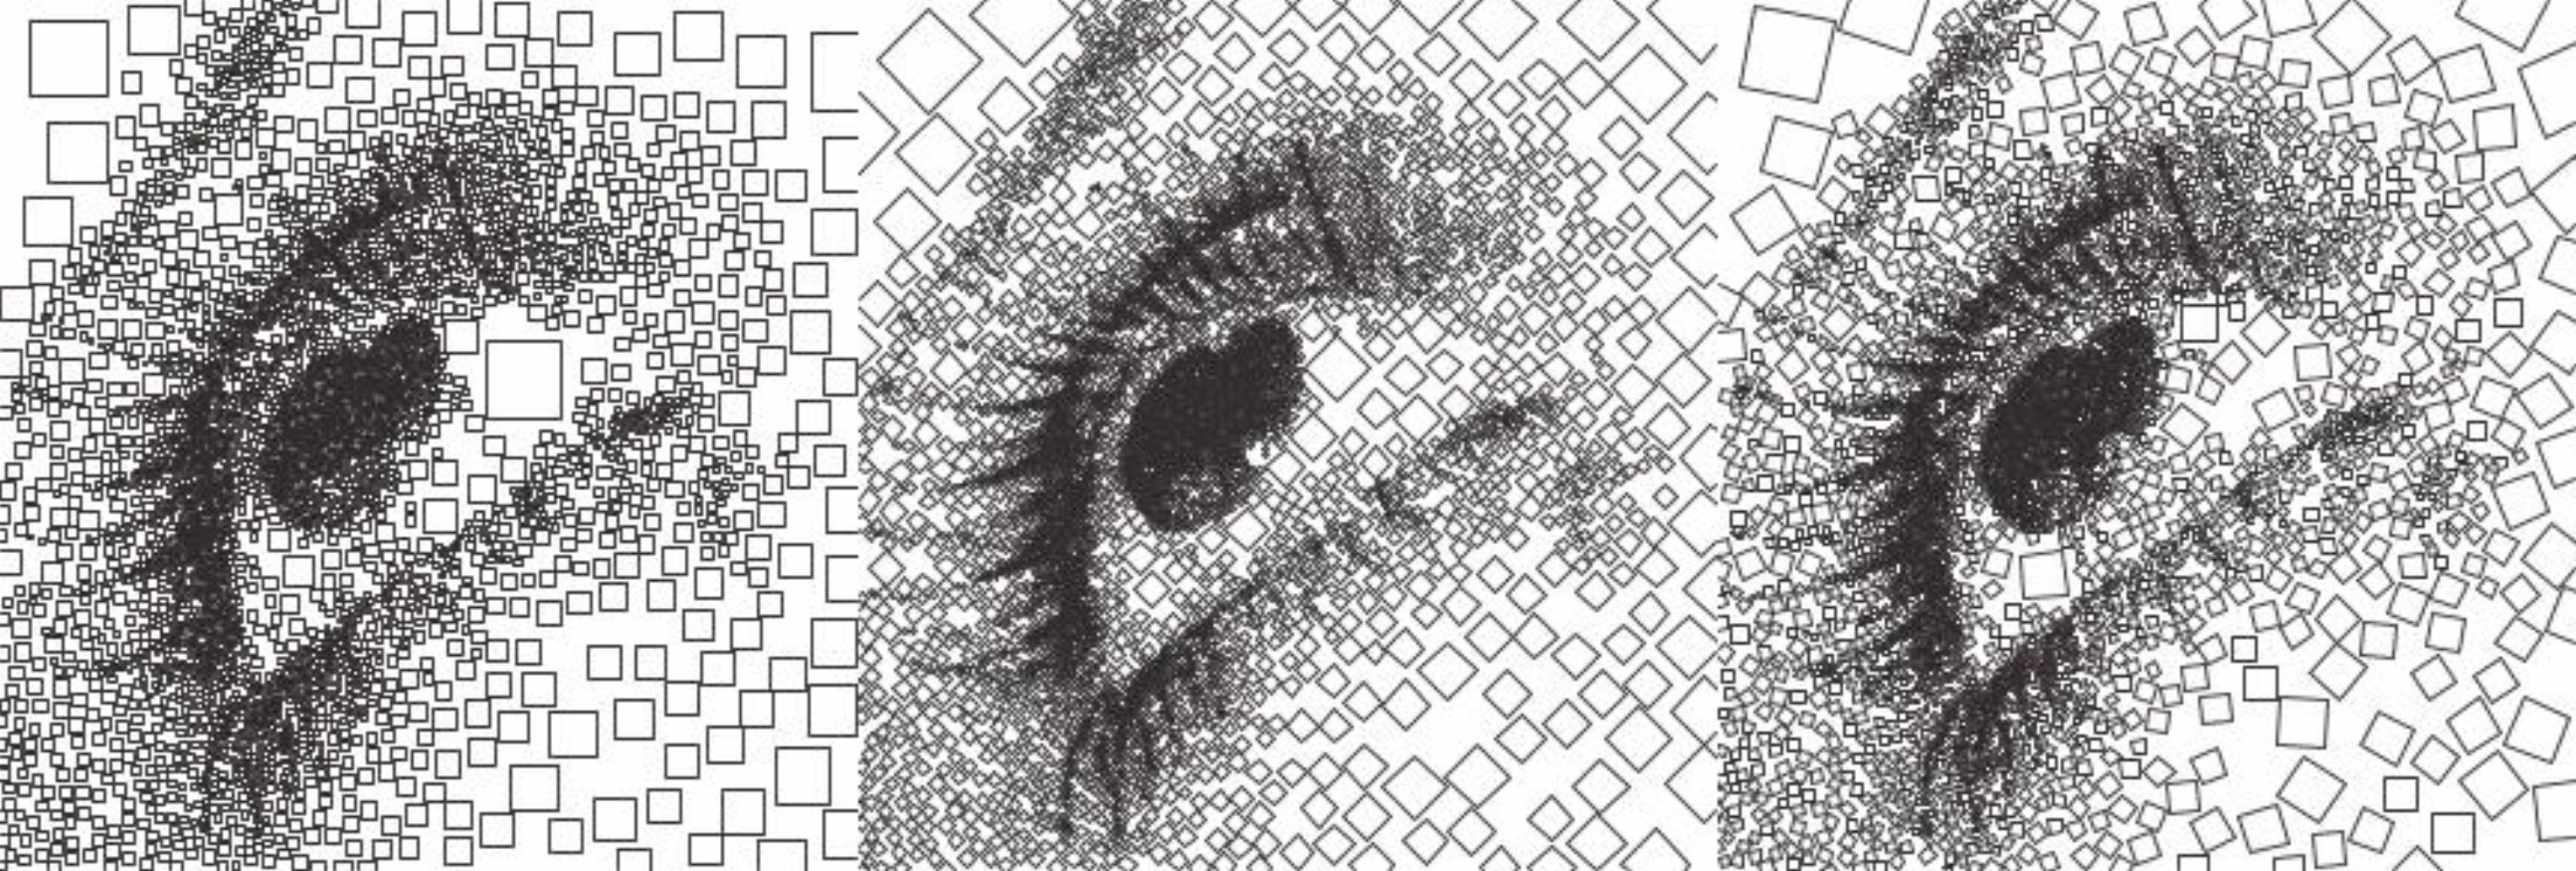
Fig 1. Min & Max Rotation = 0, Fig 2. Min & Max Rotation = 45, Fig 3. Align Rotation = True (Default)
- Fill Size (Adaptive Shapes)
Controls the scaling of the shape within the shape available (as defined by the Sampling used e.g. Adaptive, LBG or Voronoi).
\(finalRadius = sampleRadius * (fillSize/100)\)
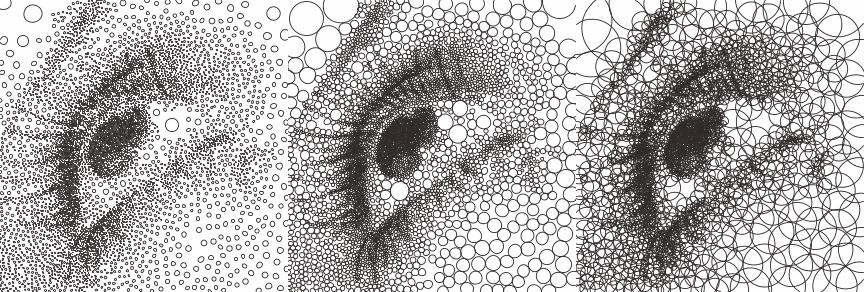
Fig 1. Fill Size = 50, Fig 2. Fill Size = 100 (Default), Fig 3. Fill Size = 200
- + Inherits settings from:
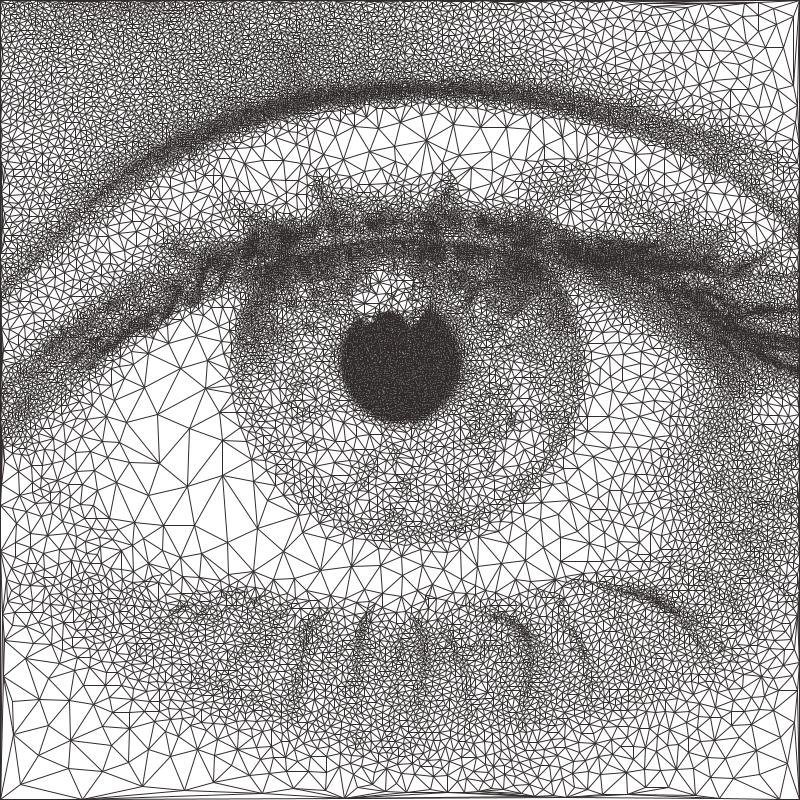
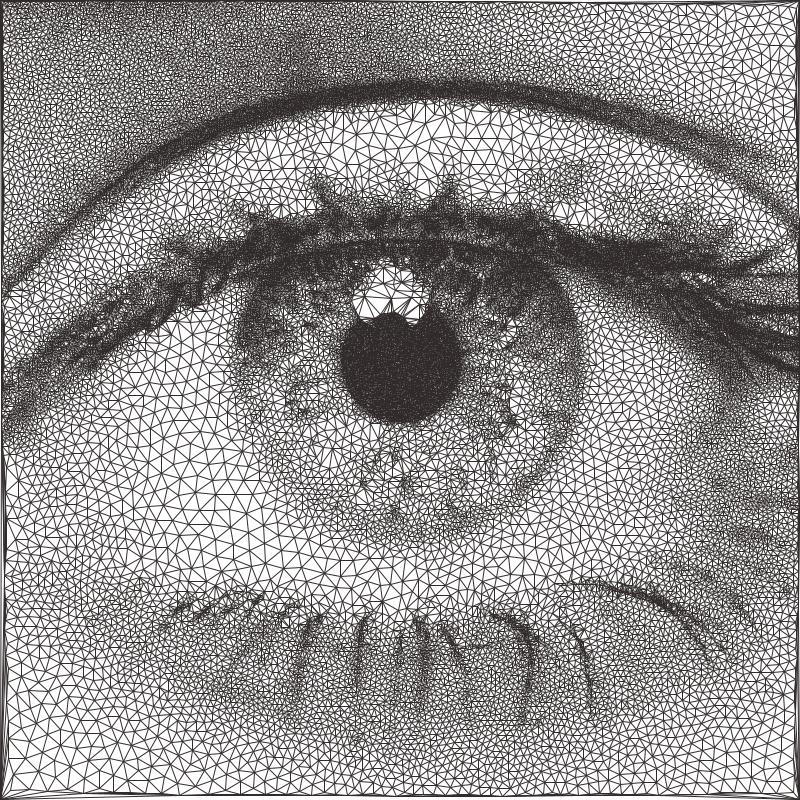
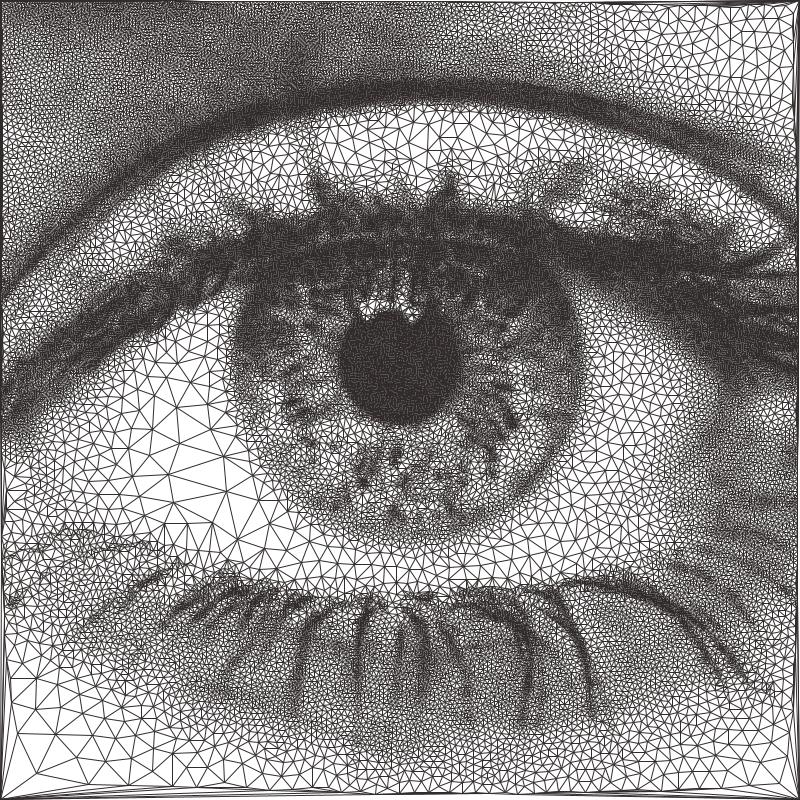
Adaptive Triangulation
Transforms an image into a series of connected triangles joining all the points generated using Delaunay Triangulation
Settings
These settings are also shared with Adaptive Triangulation, LBG Triangulation and Mosaic Triangulation
Transforms an image into a series of connected triangles joining all the sample points generated using Delaunay Triangulation.
Triangulation
- Triangulate Corners
Values: Boolean (True | False)When True, additional sample points will be added at the corners of the drawing, creating a frame out of triangles around the border of the drawing.
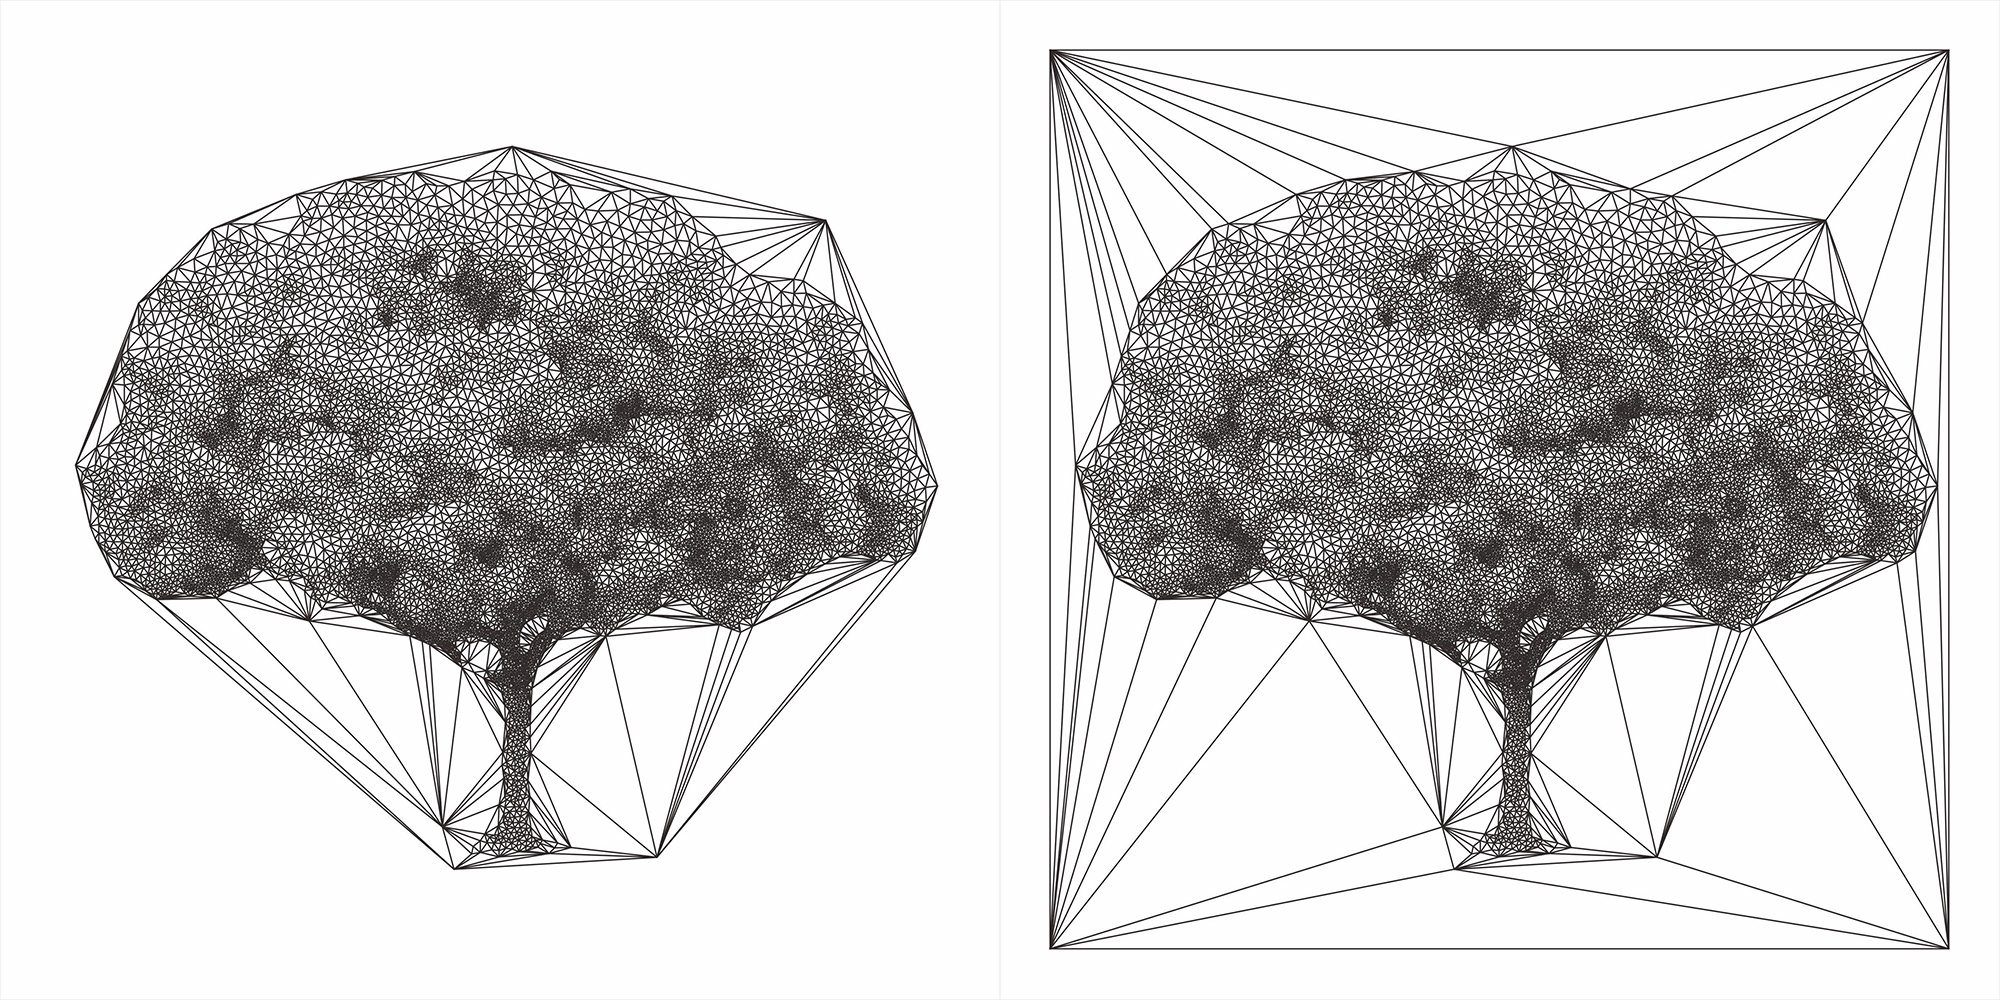
Fig 1. Triangulate Corners = False (Default), Fig 2. Triangulate Corners = True
- + Inherits settings from:
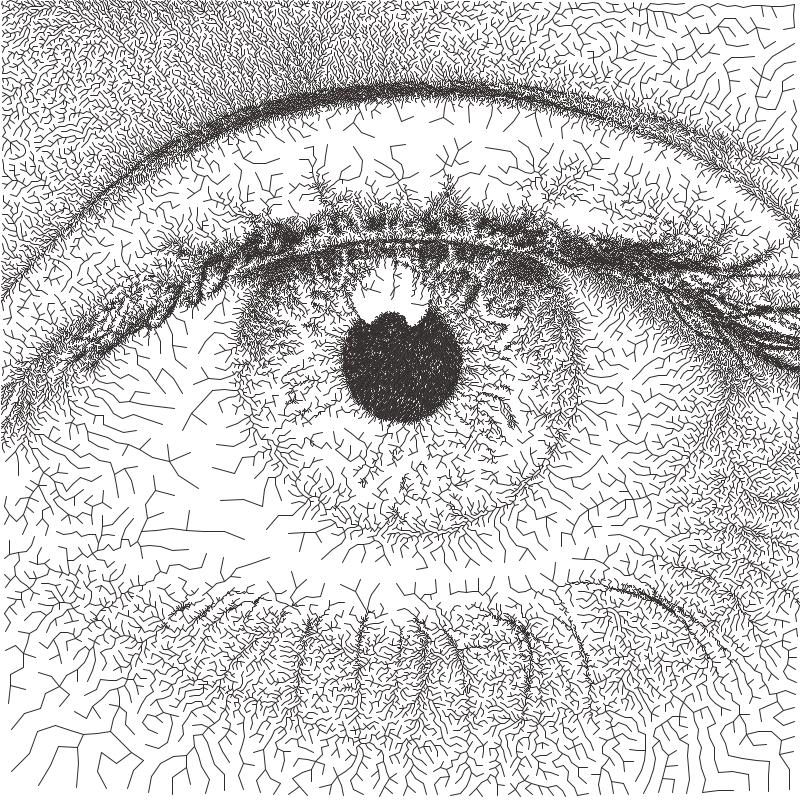
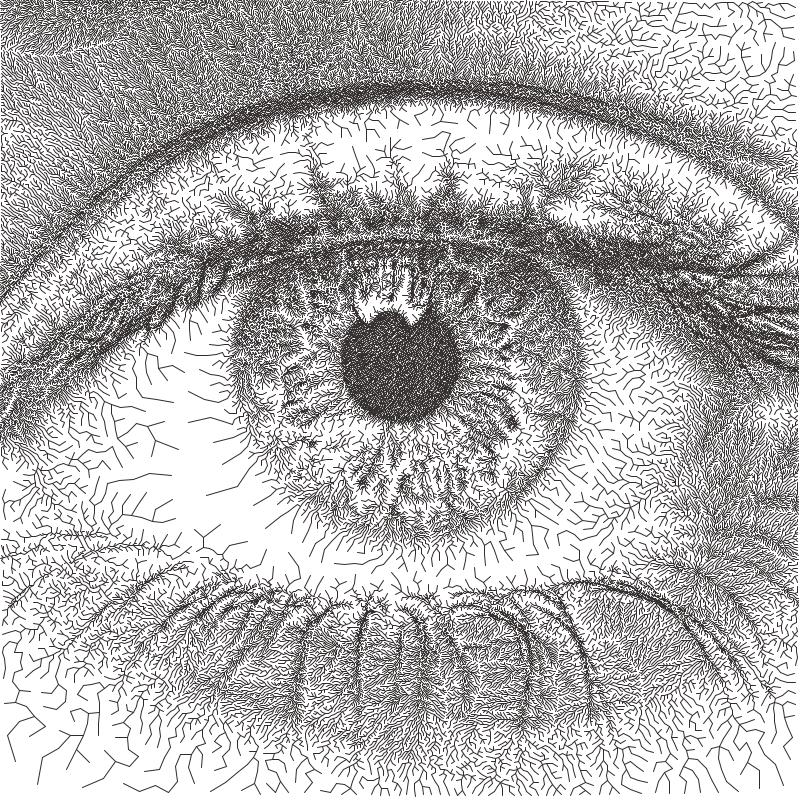
Adaptive Tree
Transforms an image into a Minimum Spanning Tree, which connects all the points by creating links between each point and its nearest neighbour.
Settings
Tree
- Create Curves
Values: Boolean (True | False)When True, the lines generated by the PFM will be converted to curves in a final finishing step.
- + Inherits settings from:
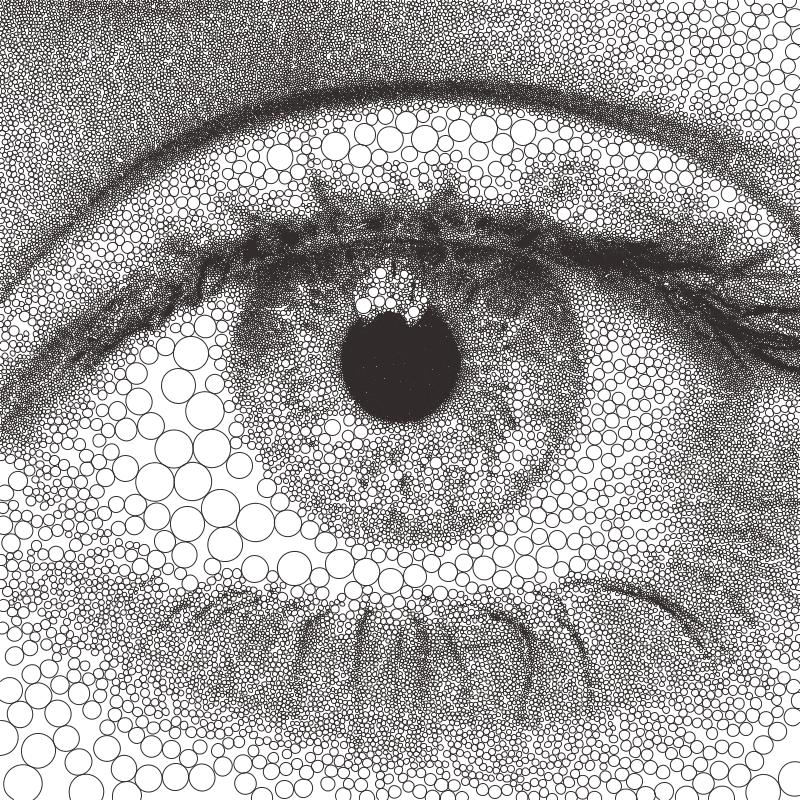
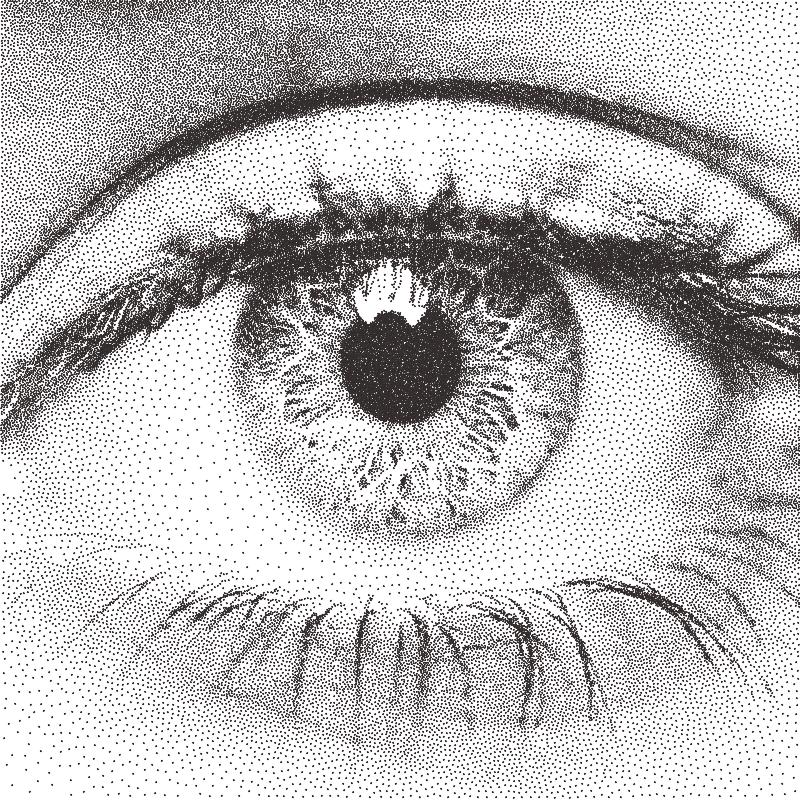
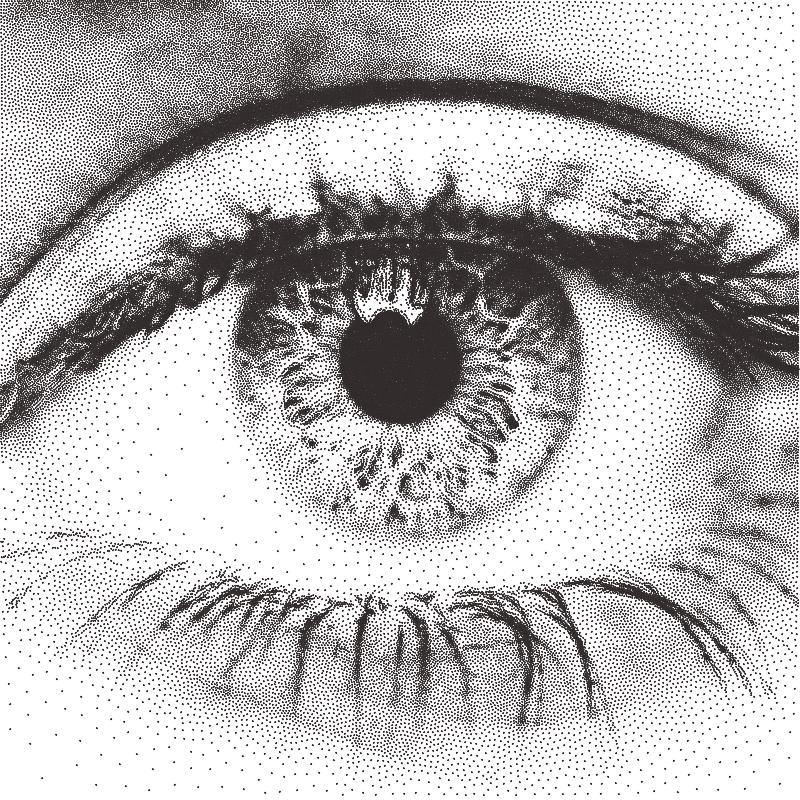
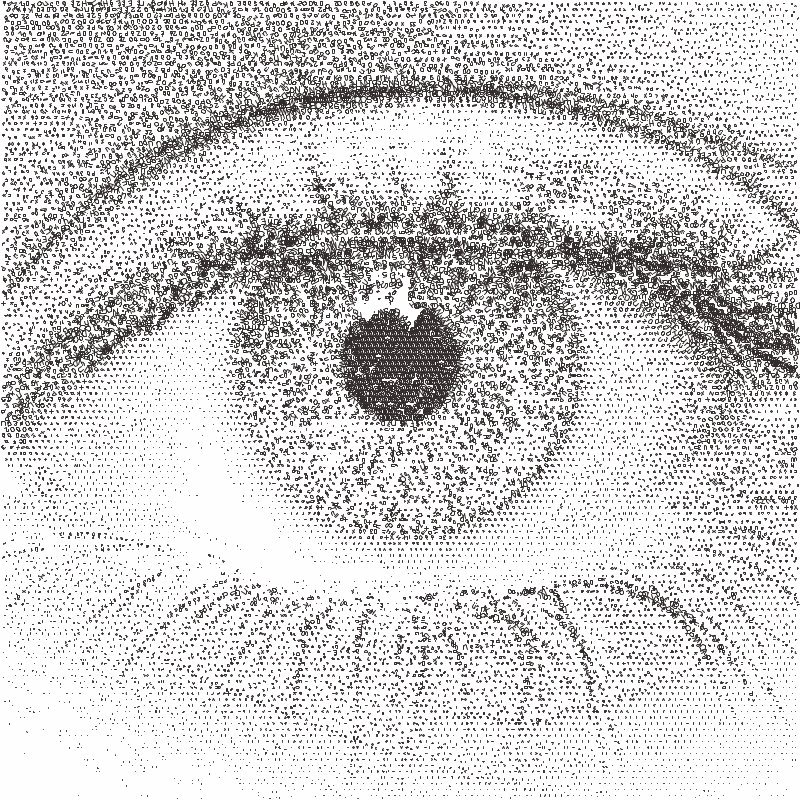
Adaptive Stippling
Transforms an image into a series of dots placed at each point generated.
Settings
Stippling
- Stipple Size
Values: Number (Safe Range: 1.0 -> 100.0)Controls the size of generated stipples.
- + Inherits settings from:
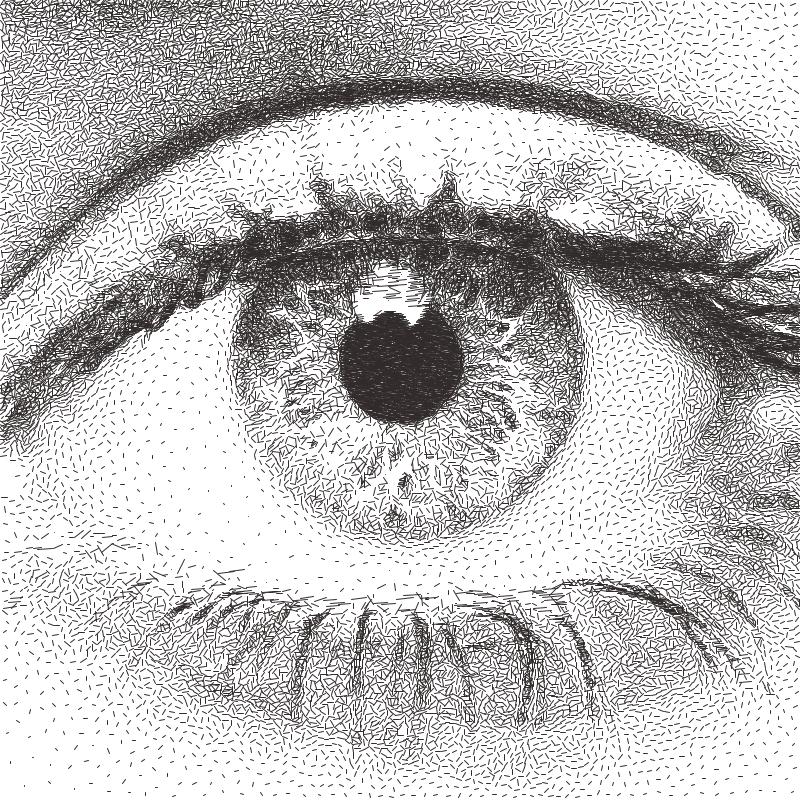
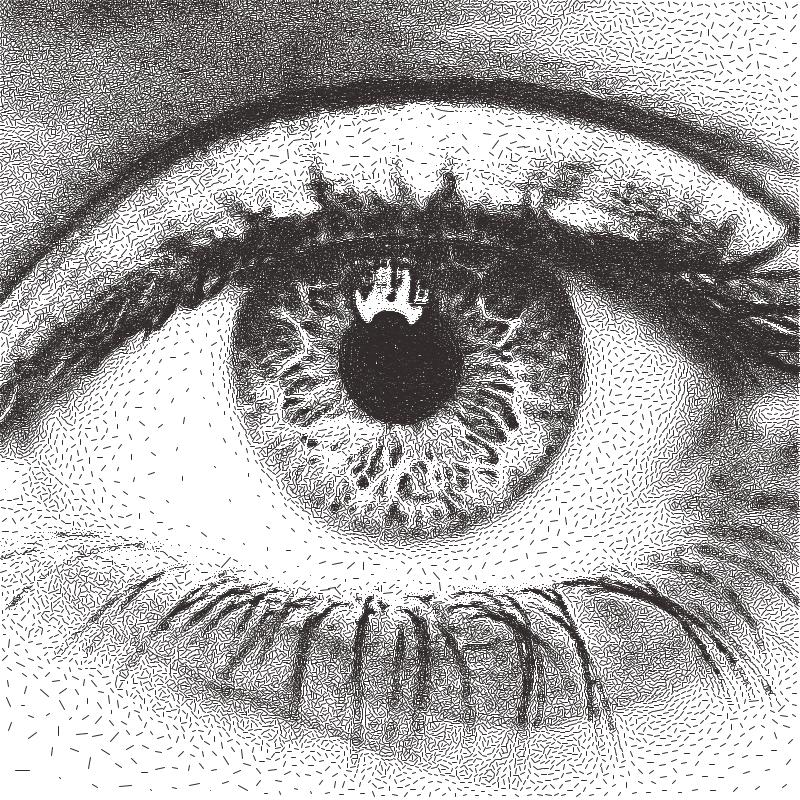
Adaptive Dashes
Transforms an image into a series of dashes placed at each point generated.
Settings
Dashes
- Distortion (Adaptive Dashes)
Values: Number (Safe Range: 0.0 -> 100.0)Controls the random distortion applied to the generated dashes, giving them a more human-like quality.
- + Inherits settings from:
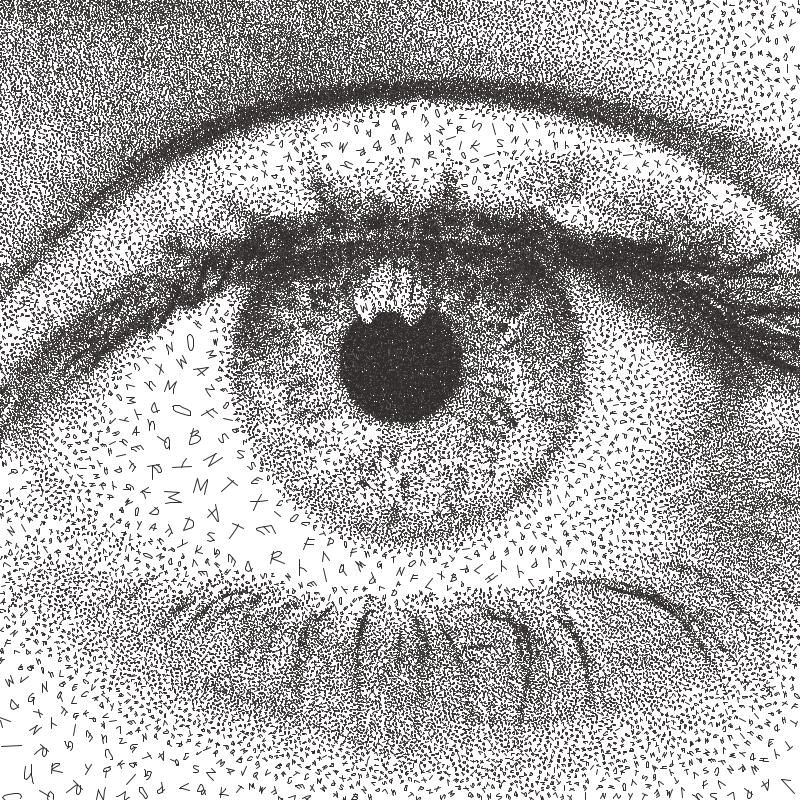
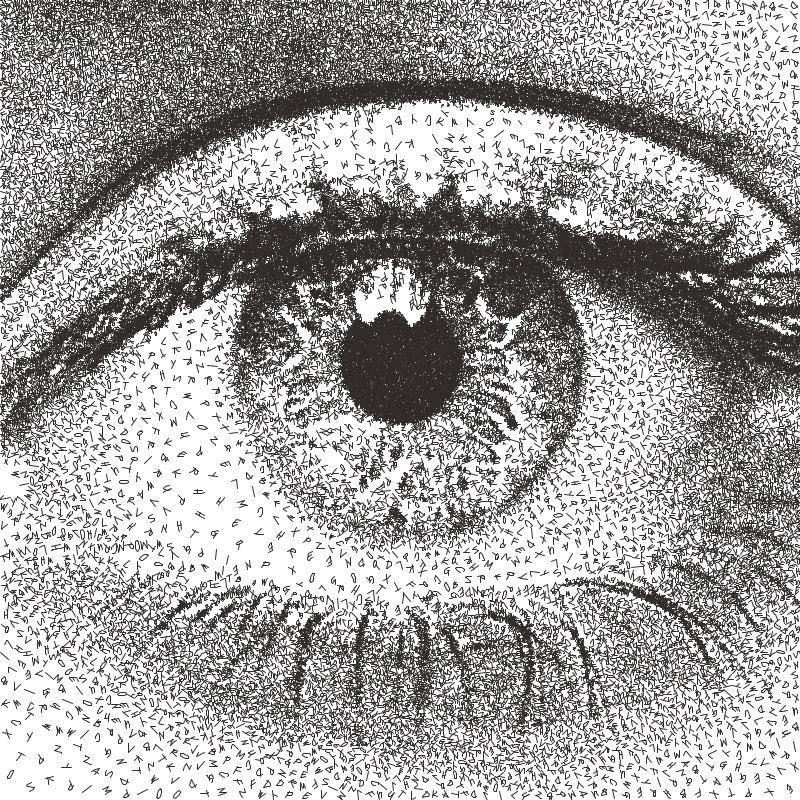
Adaptive Letters
Transforms an image into a series of letters placed at each point generated.
Settings
Letters
- Order (Letters)
Values: Tone Mapped | Random | SequencedControls how characters are selected for each sample point.
Letters will only be considered if they pass the Character Filter and RegEx Filter
- Tone Mapped
Before processing, the font’s characters will be ordered from Darkest -> Brightest. Then when selecting letters, the closest match to the image’s luminance at the sample point will be selected.
- Random
A random character will be selected at each position from the chosen SVG Font
- Ordered
Will follow the order of the allowed characters. If a Character Filter has been added then that order will be followed, allowing you to write sentences.
- Character Filter
Values: TextCombines with the RegEx Filter to define which characters are allowed in the final drawing. Characters must pass both filters.
If you leave this empty, any character available in the chosen font is allowed which passes the RegEx Filter.
If you type any text in the filter, only those included characters will be used in the final drawing.
- RegEx Filter
Values: Regular ExpressionCombines with the Character Filter to define which characters are allowed in the final drawing, characters must pass both filters.
- Examples:
[A-Z]- Matches every character from A to Z.[^A-Z]- Match every character not in the range A to Z.\d- Matches any digit\D- Matches any non-digit\w- Matches any word character\W- Matches any non-word character
Learn more about Regular Expressions.
Font
- Use SVG Fonts
Values: Boolean (True | False)When True, only SVG fonts will be available to use,
When False, you can choose from fonts available on your computer.
- SVG Font
Values: SVG FontThe included SVG fonts are Single Line Fonts which are well optimised for pen plotting.
(Thanks to Oskay from Evil Mad Scientist for allowing me to include them)
- Adding your own SVG Fonts
Go to Help / Open Configs Folder.
Copy your fonts into the
fontsfolder.Restart DrawingBotV3, and your fonts should appear in the list.
- Font
Values: Regular FontIf Use SVG Fonts is False you can choose from the fonts on your computer. Many won’t be well-suited for pen plotting!
- Style
Values: Plain | Bold | ItalicAllows you to choose the style of the letters when using your computer’s own fonts.
- + Inherits settings from:
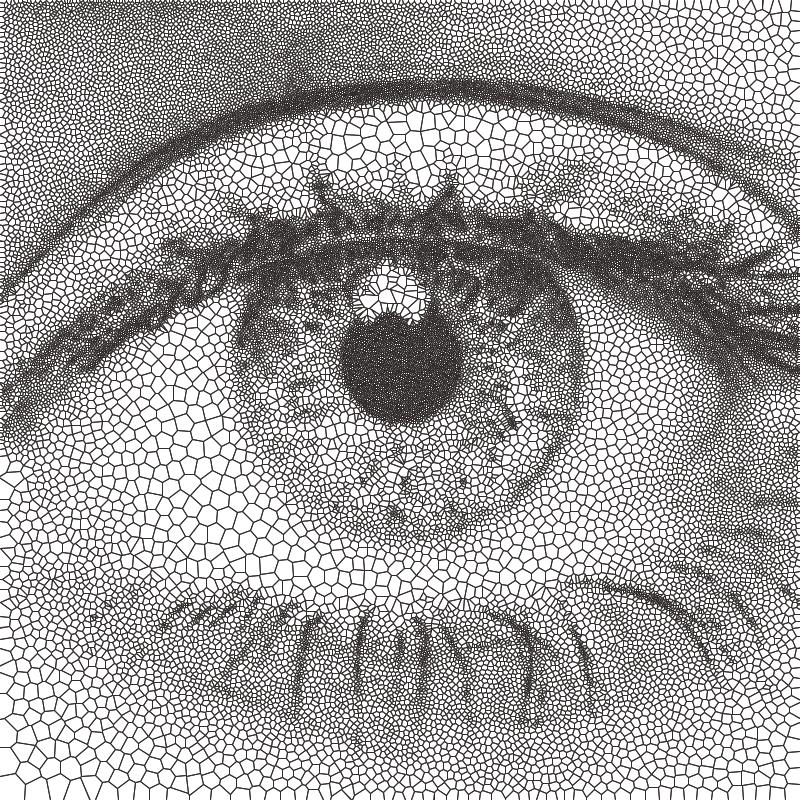
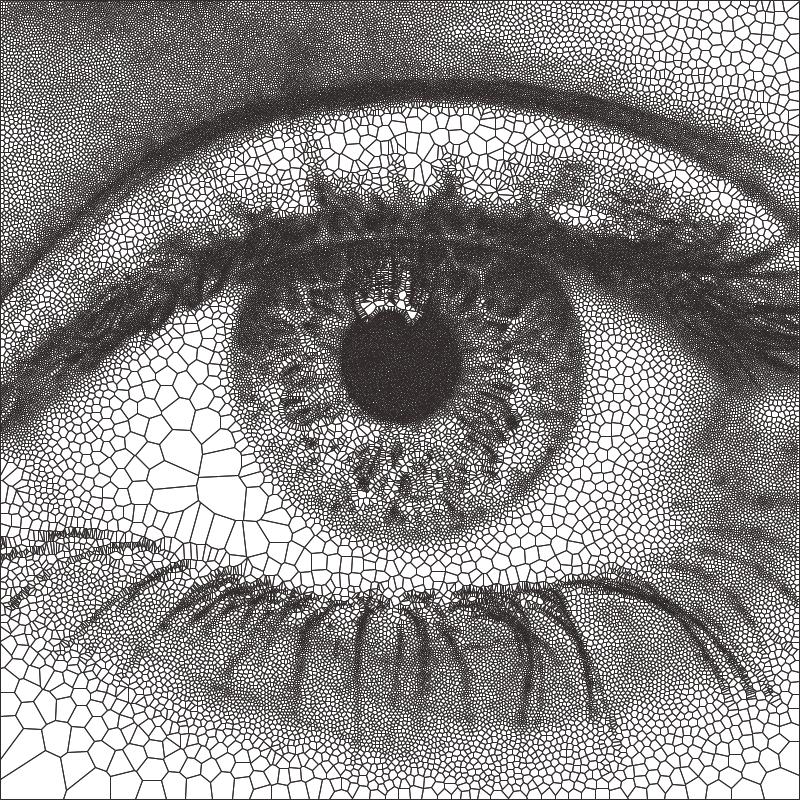
Adaptive Diagram
Transforms an image into a Voronoi Diagram which is generated from all of the evenly distributed points.
Settings
Voronoi Style
- Voronoi Style
Values: Classic | Smooth | Sharp | Offset A | Offset B | Offset CClassic - The default and original Voronoi Diagram
Smooth - A smoother version of the original, creating rounded cells which can be more visually pleasing.
Sharp - A more jagged / stylised version
Offset A, B, C - Less detailed / stylised version using the different offsets of adjacent triangles
- + Inherits settings from:
Adaptive TSP
Transforms an image into a single continuous line, or alternatively multiple individual continuous line segments.
Settings
TSP
- Merge TSP Paths
Values: Boolean (True | False)When True, the PFM will create one continuous line without any pen lifts.
When False, the individual TSP segments will not be joined and will each be drawn as separate shapes.
- + Inherits settings from:
5.6. LBG PFMs
LBS (Linde Buzo Gray) PFMs combine the speed of Adaptive PFMs with the Quality of Voronoi PFMs and in most cases will outperform both in detail retention. They also respond better to large variations in stipple spacing.
Default LBG Settings
LBG Sampling
- Stipple Radius Min/Max
Values: Number (Safe Range: 1.0 -> 100.0)The spacing between each sample point generated.
- Density
Values: Number (Safe Range: 0.0 -> 100.0)The mapping between Min/Max radius, giving control over the contrast of the image.
- Threshold
Values: Number (Safe Range: 0.0 -> 100.0)The image luminance threshold for when points should stop being generated.
- Max Iterations
Values: Number (Safe Range: 1 -> 100)Number of improvements to make to the LBG positions before stopping.
Higher iterations will result in more accurate results. If no more improvements can be made the process will stop early
- Cache Result
Values: Boolean (True | False)When enabled, if all of the settings above have remained the same the result of the LBG Sampling will not be regenerated on the next run, which saves processing time and is very useful for PFMs like LBG Circular Scribbles.
LBG Circular Scribbles
Transforms an image into a single continuous circular scribble.
This is an implementation of Chiu Et Al 2015, “Tone‐ and Feature‐Aware Circular Scribble Art”. If you wish to achieve results similar to Chiu Et Al’s implementation use a size of paper, pen width which gives you a plotting size of 4000px on the largest edge then use the “Chiu Et Al – 4000px” preset
Settings
- + Inherits settings from:
LBG Shapes
Transforms an image into a series of packed shapes
Settings
- + Inherits settings from:
LBG Triangulation
Transforms an image into a series of connected triangles joining all the points generated using Delaunay Triangulation
Settings
- + Inherits settings from:
LBG Tree
Transforms an image into a Minimum Spanning Tree, which connects all the points generated into a minimum length tree.
Settings
- + Inherits settings from:
LBG Stippling
Transforms an image into a series of dots placed at each point generated.
Settings
- + Inherits settings from:
LBG Dashes
Transforms an image into a series of dashes placed at each point generated.
LBG Letters
Transforms an image into a series of letters placed at each point generated.
Settings
- + Inherits settings from:
LBG Diagram
Transforms an image into a Voronoi Diagram which is generated from all of the evenly distributed points.
Settings
- + Inherits settings from:
LBG TSP
Transforms an image into a single continuous line, or alternatively multiple individual continuous line segments.
Settings
- + Inherits settings from:
5.7. Voronoi PFMs
All Voronoi PFMs utilise a Weighted Voronoi Diagram to determine the distribution of brightness in the original image and then use this diagram to generate new styles.
How do they work?
Randomly scatter points over the image proportional to the images brightness
Calculates a voronoi diagram based on these points.
Calculates the weighted centroids of each cell in the diagram using brightness data.
Use the generated centroids to re-calculate the voronoi diagram.
Return to step 3
The process finishes when the specified number of voronoi iterations have been performed.
Default Voronoi Settings
Voronoi Sampling
- Point Density
Values: Number (Safe Range: 1 -> 1200)Controls the overall density of the drawing.
The number of generated points will be proportional to the images size. i.e. a A4 and A3 drawing with the same density would have a similar about of points
- Point Limit
Values: Number (Safe Range: 0 -> 1000000)Controls a hard limit for the amount of points to be generated. Only has an effect if the the number is lower than the amount that would be generated by the given Point Density The limit will be ignored when set to 0.
- Luminance Power (Voronoi PFMs)
Values: Number (Safe Range: 1 -> 50)Used when randomly scattering points over the image, it affects how biased the scattering is towards darker areas of the image, typically using the same value for Density Power yields the best results.
- Density Power
Values: Number (Safe Range: 1 -> 50)Used when calculating the centroids of the voronoi diagram, it affects the calculation’s bias towards darker areas of the image, typically using the same value for Luminance Power yields the best results.
- Voronoi Iterations
Values: Number (Safe Range: 1 -> 100)How many times to re-calculate the voronoi diagram. More iterations will result in a more accurate representation of the original image.
- Voronoi Accuracy
Values: Number (Safe Range: 1 -> 100)Controls the quality of the voronoi calculation, decreases processing times.
- Ignore White (Voronoi PFMs)
Values: Boolean (True | False)When True, the PFM will filter out points in white areas of the image.
Voronoi Shapes
Transforms an image into a series of inscribed shapes for each cell of the voronoi diagram.
Settings
- + Inherits settings from:
Voronoi Triangulation
Transforms an image into a series of connected triangles joining all the centroids in the voronoi diagram using Delaunay Triangulation
Settings
- + Inherits settings from:
Voronoi Tree
Transforms an image into a Minimum Spanning Tree, which connects all the centroids in the voronoi diagram into a minimum length tree.
Settings
- + Inherits settings from:
Voronoi Stippling
Transforms an image into a series of filled circles for each centroid in the voronoi diagram, the size of the “stipple” is relative to the sampled brightness of the cell the centroid belongs to.
Settings
- + Inherits settings from:
Voronoi Dashes
Transforms an image into a series of dashes at each centroid in the voronoi diagram.
Settings
- + Inherits settings from:
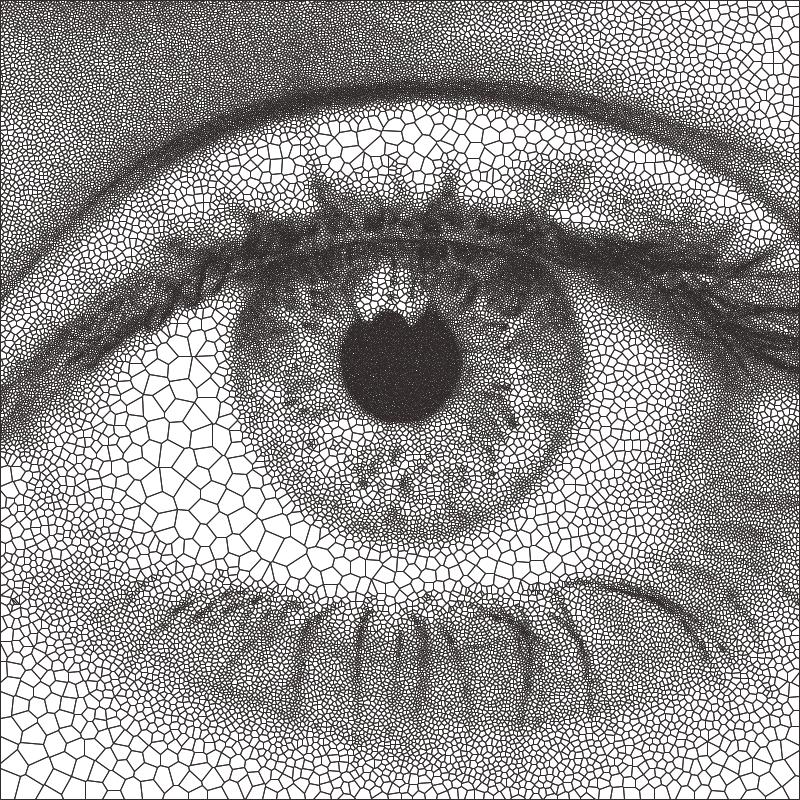
Voronoi Diagram
Transforms an image into a Voronoi Diagram.
Settings
- + Inherits settings from:
Voronoi TSP
Transforms an image into a series of connected lines for each centroid in the voronoi diagram with the shortest distance. By solving the Travelling Salesman Problem.
Settings
- + Inherits settings from:
5.8. Grid PFMS
Grid PFMs create styles using a grid, great for creating some classic half-tone drawing styles but also much more stylised drawings where the grid is only a starting point and the points may diverge away from it.
They work especially well with CMYK Separation and Colour Match
They also process very quickly due to the simplicity of generating the starting grid.
Quick Tip: Grid PFMs often work better with thicker pens 0.5mm + as this helps to introduce contrast to the grid.
Default Grid PFM Settings
Grid
- Uniform Spacing
Values: Boolean (True | False)When True, the Grid Spacing will be the same on both the X & Y Axis and the Grid Y Spacing variable will be locked.
When False, the Grid X Spacing and Grid Y Spacing can be different.
- Grid X Spacing
Values: Number (Safe Range: 1.0 -> 32.0)Controls the number of columns in the grid.
- Grid Y Spacing
Values: Number (Safe Range: 1.0 -> 32.0)Controls the number of rows in the grid, only usable if Uniform Spacing is False.
- Shape Scale
Values: Number (Safe Range: 0.01 -> 4.0)Controls the shape of the generated Shapes, a value of 1.0 will occupy all the available space in the grid.
Values higher than 1.0 will use more than the available space and cause shapes to overlap.
Values lower than 1.0 will use less than the available space.
- Rand Offset X/Y
Values: Number (Safe Range: 0.0 -> 64.0)Introduces a random X/Y offset to each grid position, introducing some natural noise to the grid.
With values higher than 0, the grid positions will no longer be uniform.
- Interleave
Values: Boolean (True | False)When True, every odd row will be offset by the grid spacing, creating interlocking grid points.
When False, the grid will be uniform.
Grid Style
- Brightness (Grid PFMs)
Values: Number (Safe Range: 0.0 -> 2.0)Controls the brightness applied as a pre-processing step to the source image, see Brightness (Adaptive PFMs)
- Contrast (Grid PFMs)
Values: Number (Safe Range: 0.0 -> 2.0)Controls the contrast applied as a pre-processing step to the source image.
The quality of Drawings from Grid PFMs can vary massively on the contrast and brightness so these controls are included for simplicity though they behave the same as adding a contrast filter in the Pre-Processing tab.
- Threshold (Grid PFMs)
Values: Number (Safe Range: 0.0 -> 100.0)Controls the cut-off luminance to stop generating grid points. Lowering the Threshold will prevent points being drawn in bright areas of the image.
- Threshold Feather
Values: Number (Safe Range: 0.0 -> 100.0)Controls a dithering process applied when a Threshold has been introduced.
When the Feather is 0 the threshold will be a hard cut-off, due to the linear nature of the grid this can become quite obvious with some settings / image combinations.
In these situations introducing a feather will add some randomness to if points are drawn or not, resulting in more gradual cut-off.
- Concentric Fills
(Grid Shapes / Letters Only)
Values: Boolean (True | False)When True, the generated shapes will be filled entirely with the pen, a continuous fill consisting of progressively smaller shapes will be generated, this is useful for introducing some more tone/contrast into the final drawing.
When False, no fills will be generated.

- Convergence
Values: Percentage (Range: 0.0 -> 100.0)Causes grid points to converge towards the darkest areas of the image making the grid no longer uniform but having the effect of emphasising edges and contrast in the image.
This is great for creating stylised results and is used in many of the default grid presets.
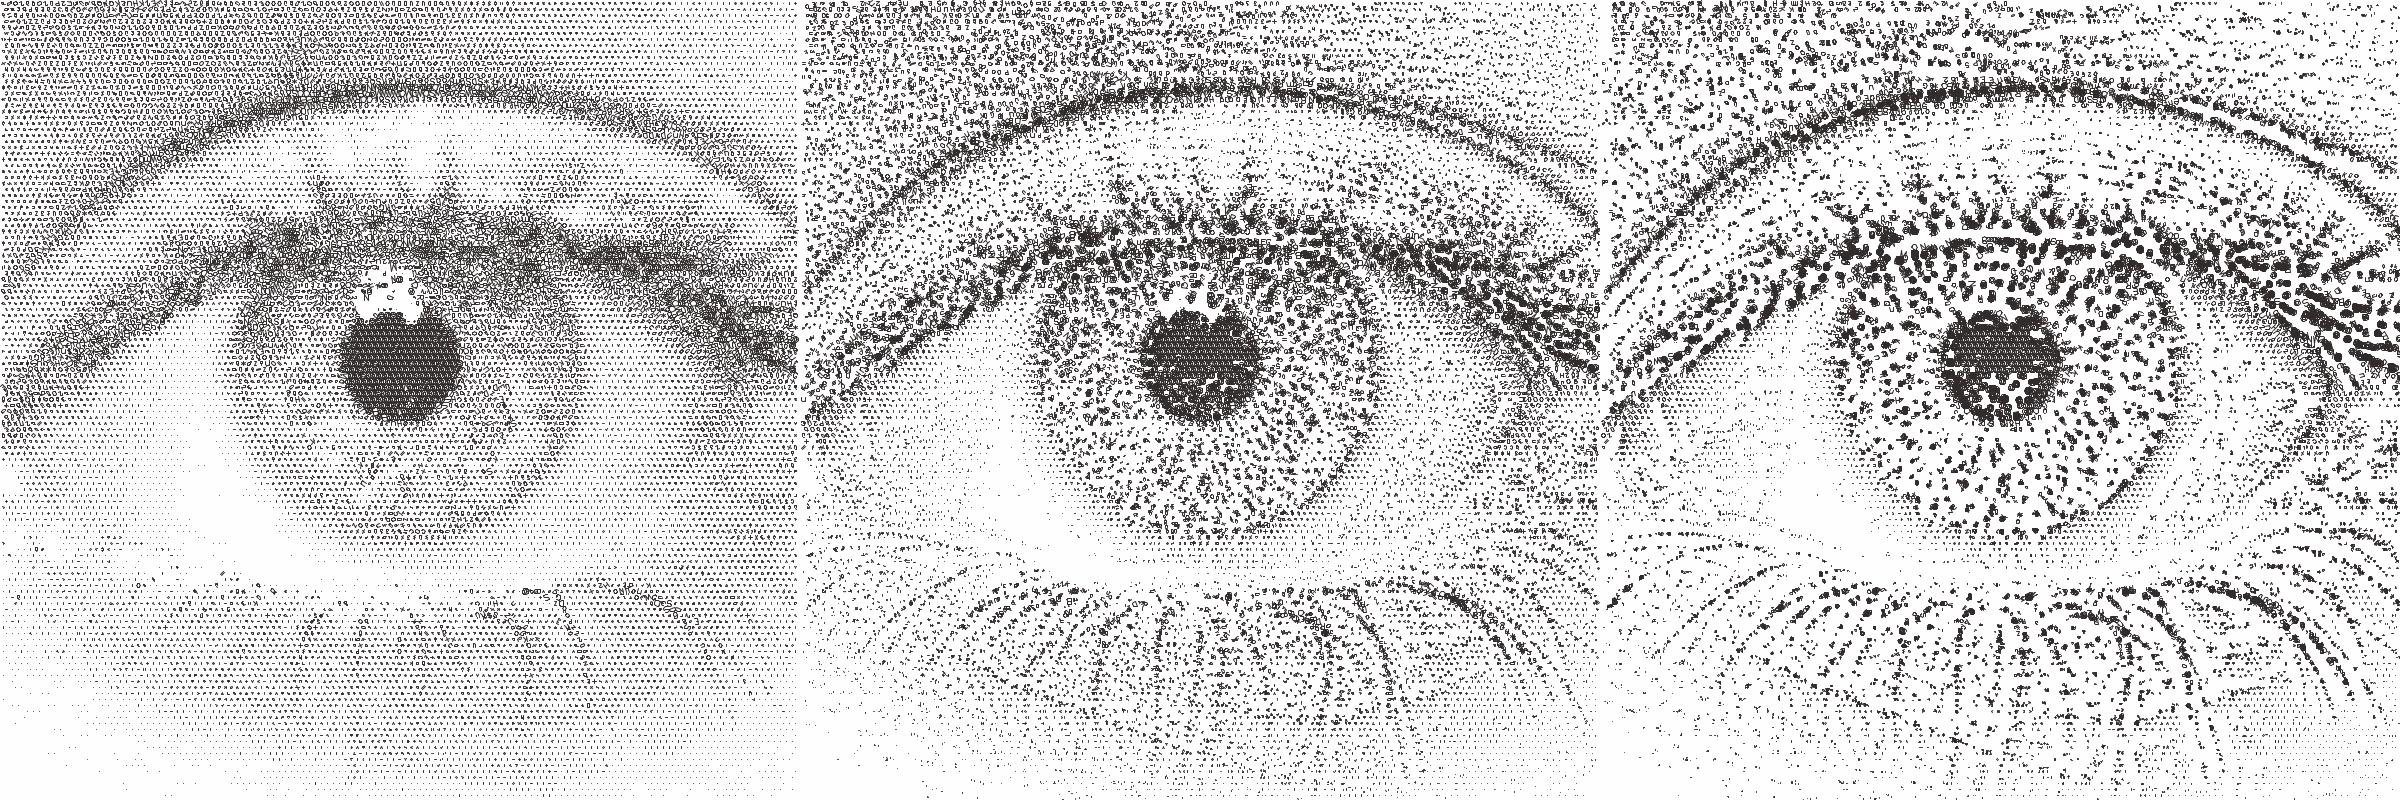
Fig 1. Convergence = 0, Fig 2. Convergence = 50, Fig 3. Convergence = 100
Grid Shapes
- + Inherits settings from:
Grid Dashes
- + Inherits settings from:
Grid Letters
- + Inherits settings from:
5.9. Composite PFMS
Composite PFMs offer different ways to combine multiple PFMs together to create new styles.
Default Composite PFM Settings
Drawing Styles
- Drawing Styles
Values: SpecialA configurable list of Drawing Styles.
A Drawing Style consists of a Path Finding Module and a Drawing Set. When run the PFM will be run with the given Drawing Set and added to the final drawing.
Upon clicking the “Drawing Styles” button in the PFM Settings you’ll be presented with this window.

Here you can configure the Composite PFM’s enabled Drawing Styles. You may add as many Styles as you wish and by selecting each one in the list on the left of the window you can configure the settings of the Path Finding Module on the right.
- Name
Defaults to the selected PFM, but can be changed by the user.
- Weight
Only visible for specific Composite PFMs
Typically the selection of PFMs for the various tiles of the mosaic is random and the random selections can be changed with the Random Seed.
However, when the weight is changed, the random selection will be weighted (similar to pen weights) and the number of tiles in the mosaic drawn in that style will be proportional to its weight.
- Drawing Set:
The selected Drawing Set. Change it by double clicking the current value. To create more Drawing Sets see Drawing Slots at the bottom of the Pen Settings tab.
Note: It’s also possible to stack multiple composite PFMs inside each other, when Composite PFMs are stacked selecting the “Drawing Styles” button will open another identical window, but the title of the window will change, indicating where in the chain of PFMs you currently are. This should be considered an Experimental feature and may result in crashes due to the complexity of deep stacks of mosaic pfms.
- Draw Outlines
(for Mosaic PFMs only)
Values: Boolean (True | False)When True, the shapes used to generate the mosaic will also be output as Shapes, giving each Mosaic Cell/Tile a sharp outline.
Mosaic Rectangles
Divides an image into a series of rectangles which can are then distributed randomly amongst the enabled Drawing Styles
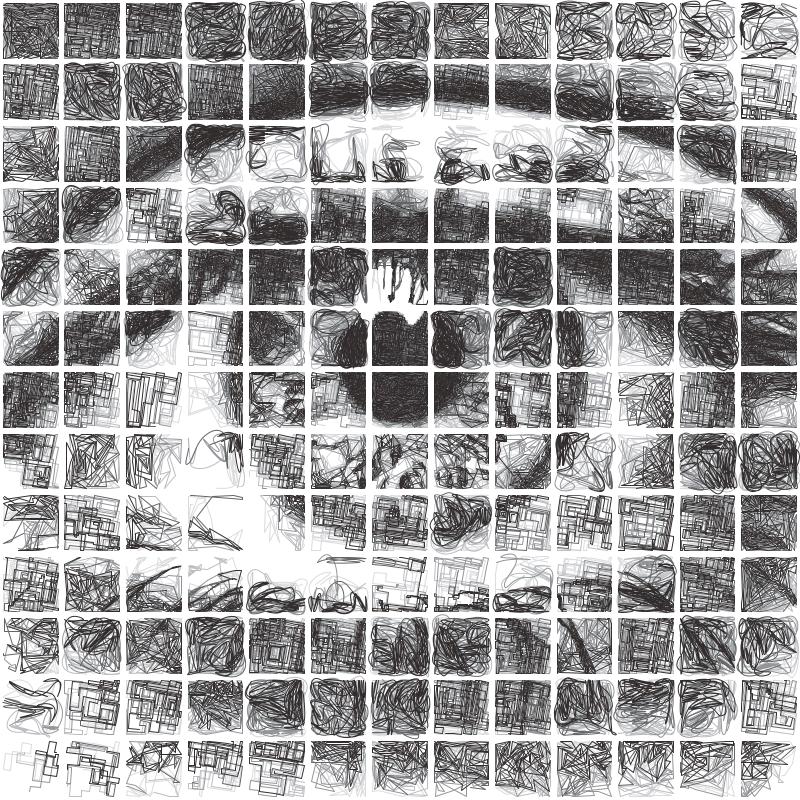
Settings
Tiles
- Square Tiles
Values: Boolean (True | False)When True, instead of rectangles the PFM will only produce Squares, the row & row padding sliders will be disabled.
- Columns
Values: Number (Safe Range: 1 -> 64)Controls the number of columns along the x axis and therefore affects the total number of tiles in the mosaic.
- Rows
Values: Number (Safe Range: 1 -> 64)Controls the number of rows along the y axis and therefore affects the total number of tiles in the mosaic.
- Column Padding %
Values: Percentage (Range: 1 -> 100)Controls the border of the rectangle on the left and right as a percentage of the tiles width.
- Row Padding %
Values: Percentage (Range: 1 -> 100)Controls the border of the rectangle on the top and bottom as a percentage of the tiles height.
Mosaic Voronoi
Divides an image into a Voronoi Diagram, each cell is distributed randomly amongst the enabled Drawing Styles.
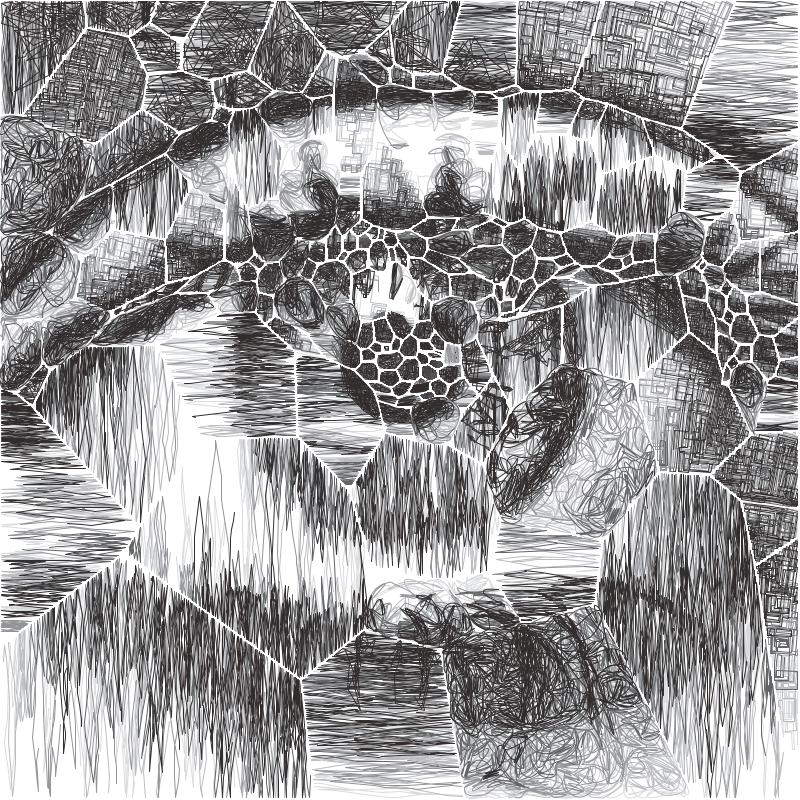
Settings
Tiles
- Tile Count (Mosaic Voronoi)
Values: Number (Range: -20 -> 20)Controls the number of Voronoi Tiles to generate / how many times to split the input image.
- Offset Cells
Values: Percentage (Range: -20 -> 20)Shifts the border of the generated Voronoi Tiles. Negative values will shrink the cell, positive values will grow the cell. Note: Negative values may result in nothing being drawn in cells if they become too small.
- + Inherits settings from:
Mosaic Triangulation
Divides an image into a Mosaic using Delaunay Triangulation. Each triangle is distributed randomly amongst the enabled Drawing Styles.
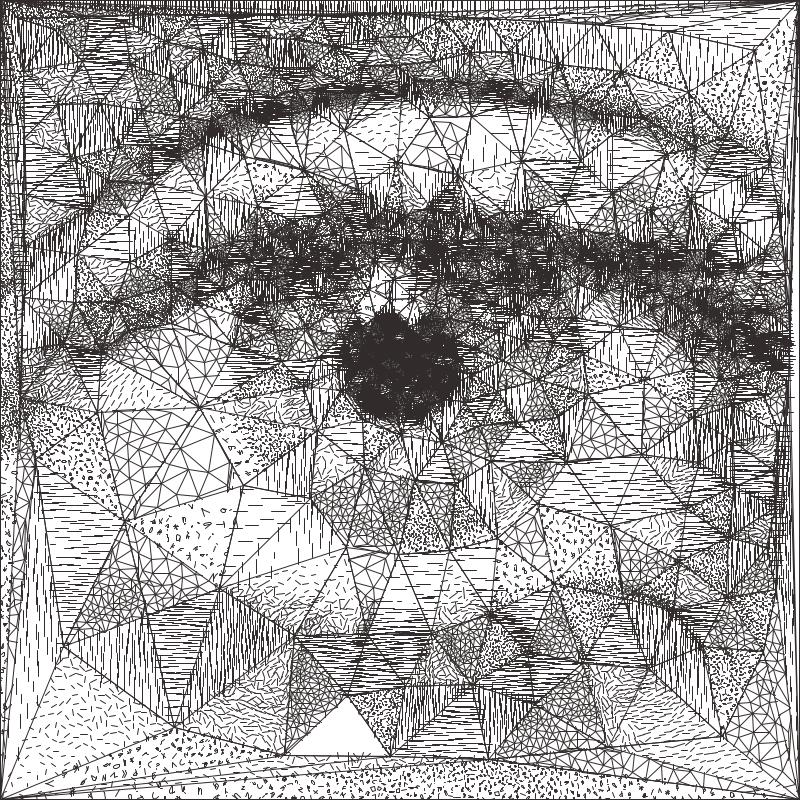
Settings
- + Inherits settings from:
Mosaic Segments
Generates a mosaic out of detailed segments using Simple Linear Iterative Clustering (SLIC Image Segmentation), the shapes it generates represent the shapes present in the original drawing much more accurately that Mosaic Voronoi.
Generating accurate segments means this PFM will pause for up to 20 seconds before processing.
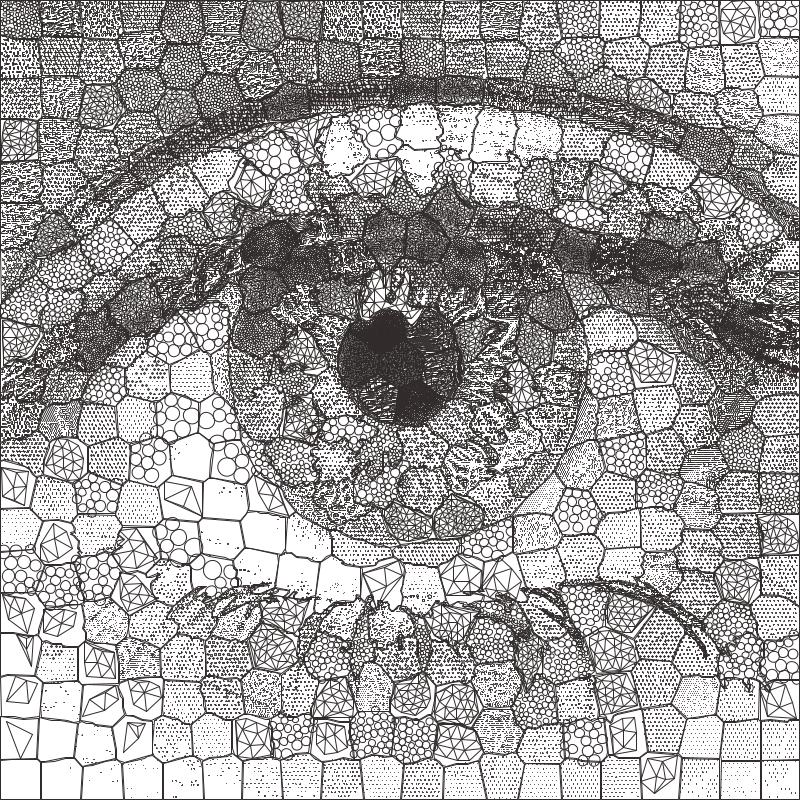
Settings
Segments
- Segments
Values: Number (Safe Range: 1 -> 5000)Controls the total number of segments to generate with SLIC Image Segmentation. Higher values will take longer to process and may crash for certain images / computers.
- Iterations
Values: Number (Safe Range: 1 -> 100)Controls the accuracy of the SLIC Image Segmentation, more iterations = longer processing time, more accurate segments.
- Compactness
Values: Number (Safe Range: 1 -> 100)Adjusts the outline of the segments generated, high values = flatter cells, formed of straight lines, low values = messy cells, with rough outlines
- + Inherits settings from:
Mosaic Custom
Note: Mosaic Custom is under revision
Layers PFM
Layers all of the Drawing Styles on top of each other, with each Style being run once and covering the entire image.
The Drawing Styles are layered in the order they are listed in the Drawing Styles menu.
Settings
Layers
- Keep Lightened Image
Values: Boolean (True | False)When True, the Layers PFM will take the Lightened Image (see __`Erasing` for more details) at each stage in the plotting process and pass it onto the next PFM.
The Lightened Image is typically only used by Sketch PFMs, , so if you are layering multiple Sketch PFMs enabling this option will limit the amount of overlap as each Sketch PFM will essentially start where the last finished. If you have other types of PFMs layered after a Sketch PFM with Keep Lightened Image enabled their outputs will also be affected.
- Layer Distribution
Values: NONE | ORDERED PER PFM | ORDERED- Which allows finer control over the distribution of pens between layers
NONE: Layers will be distributed separately.
ORDERED PER PFM: Layers which use the same PFM and Drawing Set will be distributed together, treating the first layer as the darkest and the last layer as the brightest.
ORDERED: Same as the above, but only distributes matches Drawing Sets and ignores the used PFM.
- + Inherits settings from:
5.10. Special PFMS
ECS Drawing
Settings
Edges
- Draw Edges
Values: Boolean (True | False)Disables/Enables edge detection.
- Edge Blur
Values: Number (Safe Range: 0 -> 50)Affects the pre-filter blur applied before edges are detected. Higher edge blur will result in less edges but the edges will be smoother.
- Edge Detail
Values: Number (Safe Range: 0 -> 255)Controls the amount of edges which are generated: lower detail -> less edges : higher detail -> more edges.
- Edge Simplify
Values: Number (Safe Range: 0 -> 100)Simplifies the generated edges, removing unnecessary vertices.
- Edge Distortion
Values: Number (Safe Range: 0 -> 100)Introduces noise to the generated edges, giving them a rougher more inaccurate appearance.
Contours
- Draw Contours
Values: Boolean (True | False)Disables/Enables contour detection.
- Contour Blur
Values: Number (Safe Range: 0 -> 99)Similar to Edge Blur but for contours. Has a greater impact on the amount of contours and quality of the contours.
- Contour Detail
Values: Number (Safe Range: 0 -> 255)Controls the amount of contours which are generated: lower detail -> less contours : higher detail -> more contours.
- Contour Simplify
Values: Number (Safe Range: 0 -> 100)Simplifies the generated contours, removing unnecessary vertices.
- Contour Distortion
Values: Number (Safe Range: 0 -> 100)Introduces noise to the generated contours, giving them a rougher more inaccurate appearance.
Shading (ECS Drawing)
- Draw Shading
Values: Boolean (True | False)Disables/Enables shading. The shading component uses a simplified version of the Sketch Lines shading feature, you may choose to disable the shading entirely and overlay another Sketch PFM using PFM Layers.
- Shading Accuracy
Values: Number (Safe Range: 0 -> 100)Controls the accuracy of the shading: lower -> less accurate, more stylised : higher -> more accurate, less stylised
- Shading Detail
Values: Number (Safe Range: 0 -> 100)Controls the luminance at which shading will be stopped: lower -> less shading : higher -> more shading
- Shading Length
Values: Number (Safe Range: 0 -> 150)Controls the maximum length of the lines which make up the shading.
SVG Converter
Settings
Shape
- SVG Path
Values: SVG File PathThe path to the SVG to be used. If this isn’t set it will use the current imported SVG, if there isn’t one the PFM will produce no output. You can use this PFM as part of a Layers PFM, to layer SVGs together, when you run the PFM like this you can set the SVG Path to use an SVG which hasn’t been imported.
- Shape Clipping
Values: Boolean (True | False)When enabled Solid Shapes will “clip” the shapes below, meaning if a shape is covered by another in the SVG only the visible part will be drawn, this only occurs for solid shapes, individual lines won’t clip the shapes below.
- Derive Drawing Set
Values: Boolean (True | False)When True, a new Drawing Pen will be generated for each colour in the SVG, allowing you to access them each as layers. This opens up possibilities for splitting SVGs by colour using a per/layer export, or even re-assigning colours to your SVG, once the SVG Converter PFM has been run you’ll have access to change the colour of lines with all the tools available with a default drawing.
Hatch Fill
If shapes in the SVG have solid fills, hatch fills will be used instead which can easily be drawn by a pen plotter
- Shape Filling (Hatch Fill)
Values: Boolean (True | False)When enabled Hatch Fills will be generated.
- Spacing (Hatch Fill)
Values: Number (Safe Range: 1 -> 10)The distance between the hatch lines. This is relative to the pen width so a spacing of 1.0 will draw over the entire shape with no gaps, a spacing of 2.0 will leave spaces the same width as the pen.
- Min/Max Rotation (Hatch Fill)
Values: Number (Safe Range: 0 -> 360)Controls the rotation of the generated hatch lines
- Link Ends (Hatch Fill)
Values: Boolean (True | False)Links the resulting hatch lines to create one continuous line (for some shapes this may not always be possible)
- Crosshatch (Hatch Fill)
Values: Boolean (True | False)Creates an additional set of perpendicular Hatch Lines
Video Tutorial
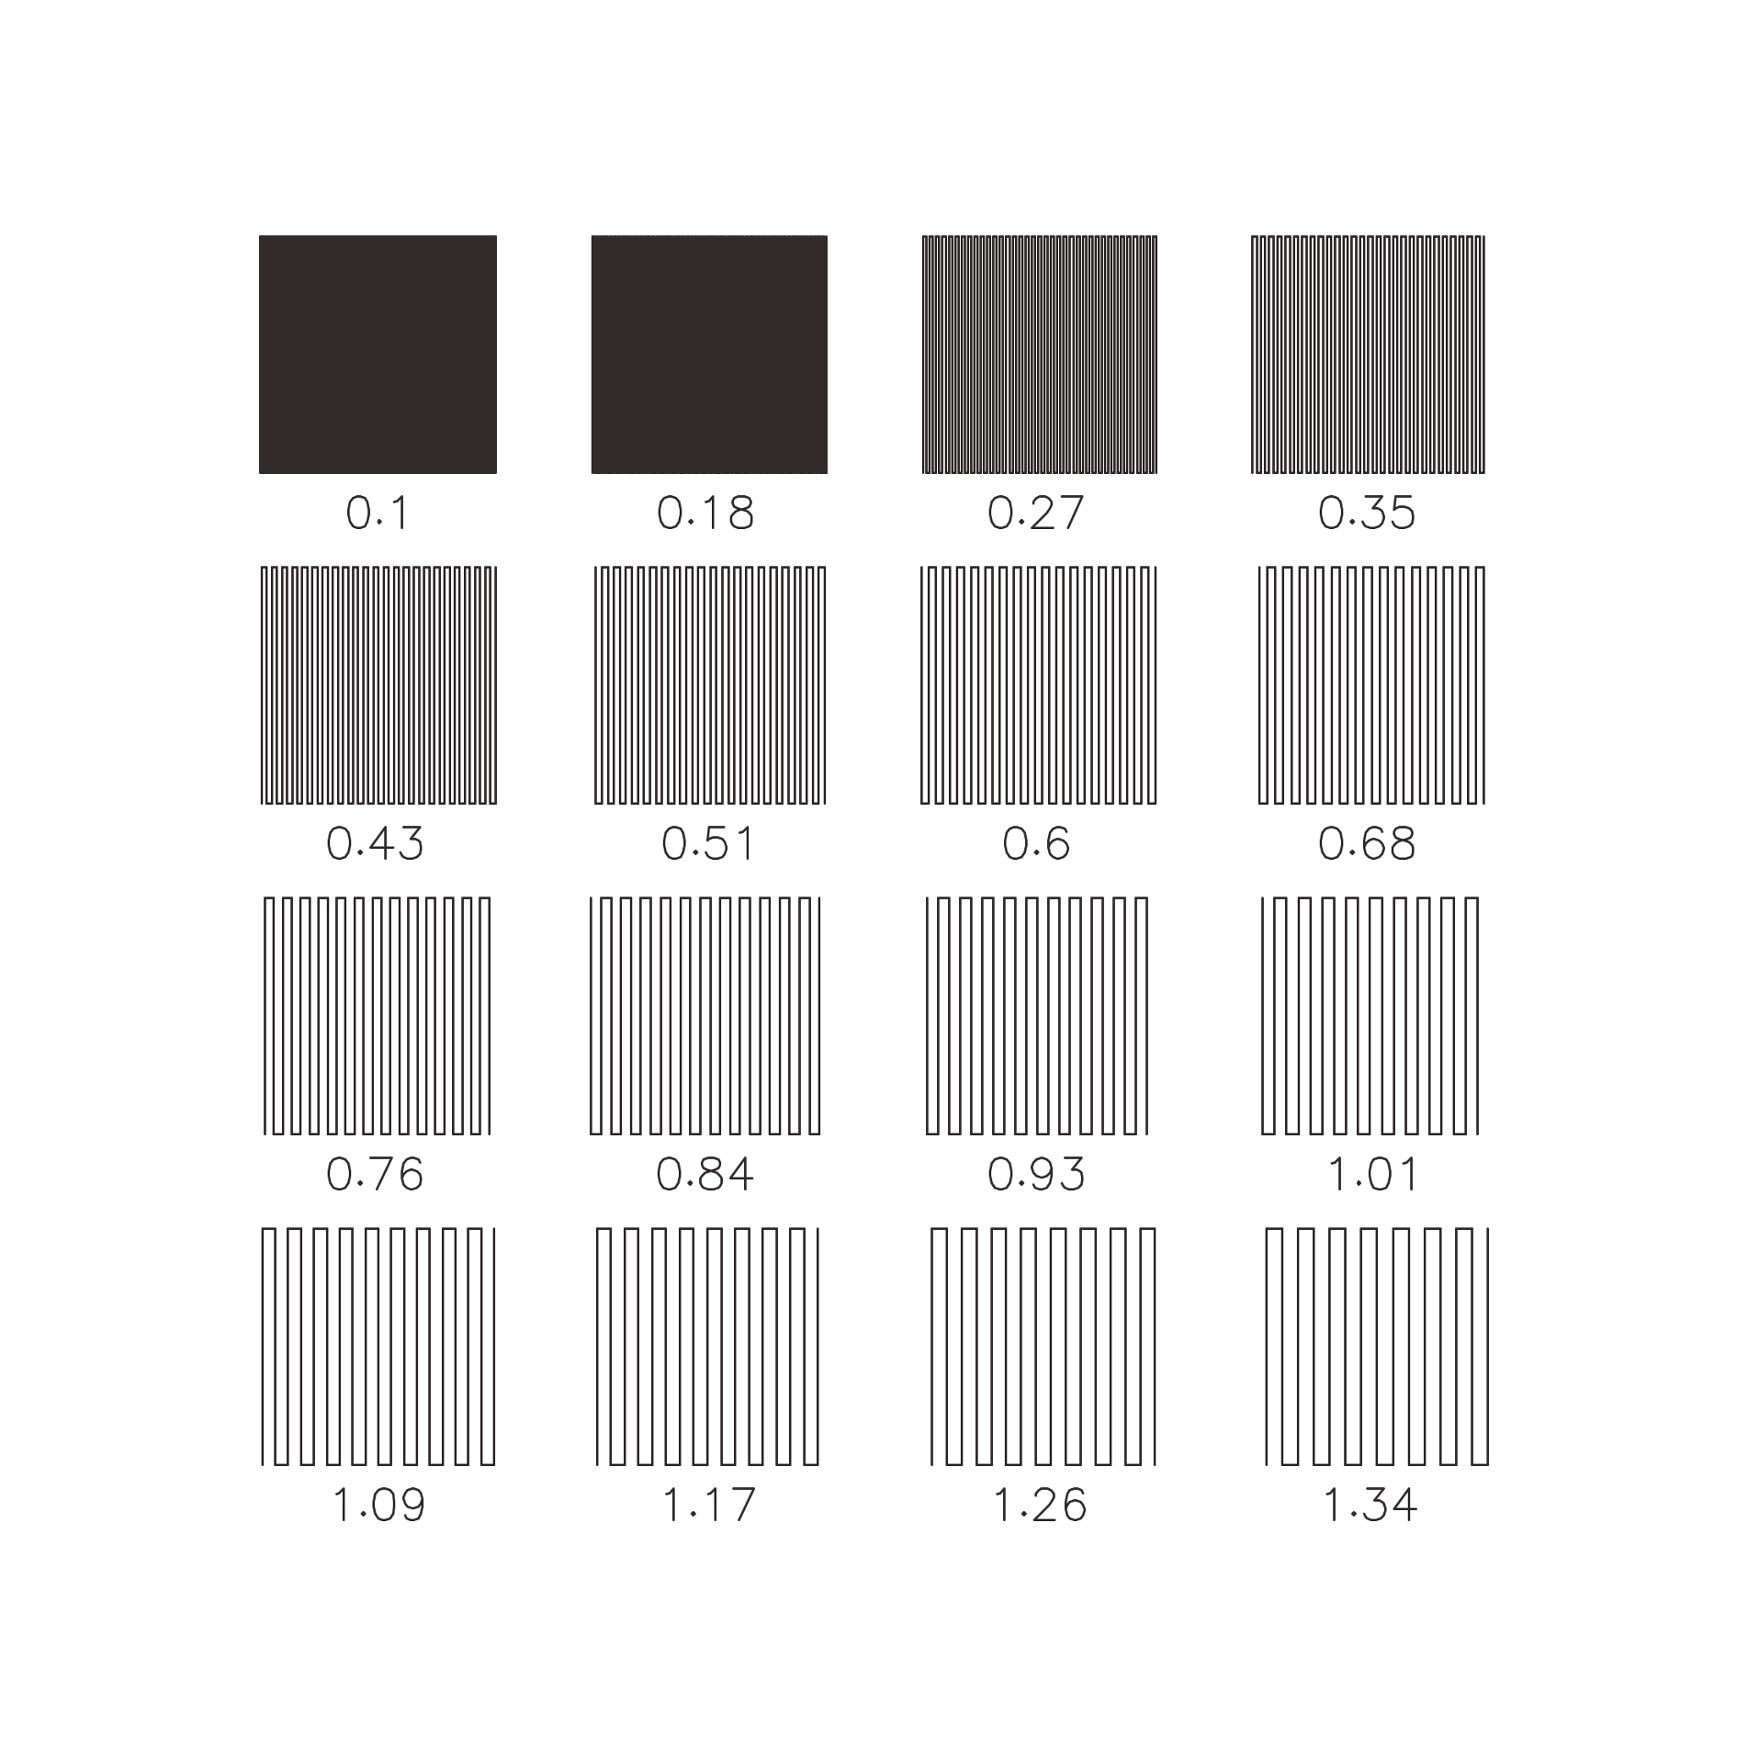
Pen Calibration
Generates Pen Calibration tests which can be used to select the most accurate nib size for “Rescale to Pen Width”. Choose a suitable Nib Size range for the pen you wish to test and then plot the test. Then set your Pen Width for future plots with that pen to the highest nib size which has no gaps between the lines.
Settings
Layout
- Nib Size Min
Values: Number (Safe Range: 0.1 -> 2.0)The smallest nib size to test.
- Nib Size Max
Values: Number (Safe Range: 0.1 -> 2.0)The largest nib size to test. If your pen is larger than 2.0, enter the value manually in the text field.
- Test Count
Values: Number (Safe Range: 0 -> 2.0)The number of calibration tests to run.
- Test Size
Values: Number (Safe Range: 10.0 -> 40.0)The width/height in mm of each nib size test.
- Spacing X/Y
Values: Number (Safe Range: 0 -> 40.0)The grid spacing in mm between each test in the grid.
- Rotation
Values: Number (Safe Range: 0 -> 360.0)Controls the angle of the lines in the generated line tests.
- Line Tests
Values: Boolean (True | False)Generates simple hatches line tests.
- Circle Tests
Values: Boolean (True | False)Generates concentric circle tests.
Text
- SVG Font (Pen Calibration)
Values: SVG FontThe SVG Font to use to draw the labels for each nib size test.
- Title
Values: TextAn optional title to draw at the top of page, you can leave this blank to have no title.
- Font Size
Values: Number (Safe Range: 1.0 -> 8.0)The height in mm of the label/title text.